
May 11, 2023
 When consumers hear the word sale, they are often persuaded to make purchases they may otherwise deem unnecessary. It implies “a better bang for your buck.” That is why when a pair of sneakers is advertised as being 25% off, we are intrigued by the opportunity and want to take advantage of it. Retail shoppers welcome discounts because the underlying logic is that they are receiving excess value for the money spent. However, in the stock market, when prices drop, it is not often that people have the same positive reaction. They do not think sale, they think lost value. This can happen even when they are actively adding to their investment account. Impulse buying on Amazon is more appealing than impulse buying of Amazon (stock) even if both items are 25% cheaper than they were in the recent past.
Consumers do not see investing in the same light as discretionary spending, regardless of the fact that the former has had recurring periods of recovery from selloffs, and the latter often only depreciates after purchase. According to data analyzed by economists Daniel Kahneman and Amos Tverskey1, most investors act illogically when making investment decisions based on their “gut.” This pattern of irrational decision making can be explained by loss aversion theory, which states that the negative affect of a loss is greater than the positive impact of a gain of the same amplitude. In other words, the magnitude of pain felt by an investor is more if they lost $1,000 when compared to the happiness if they had gained $1,000.
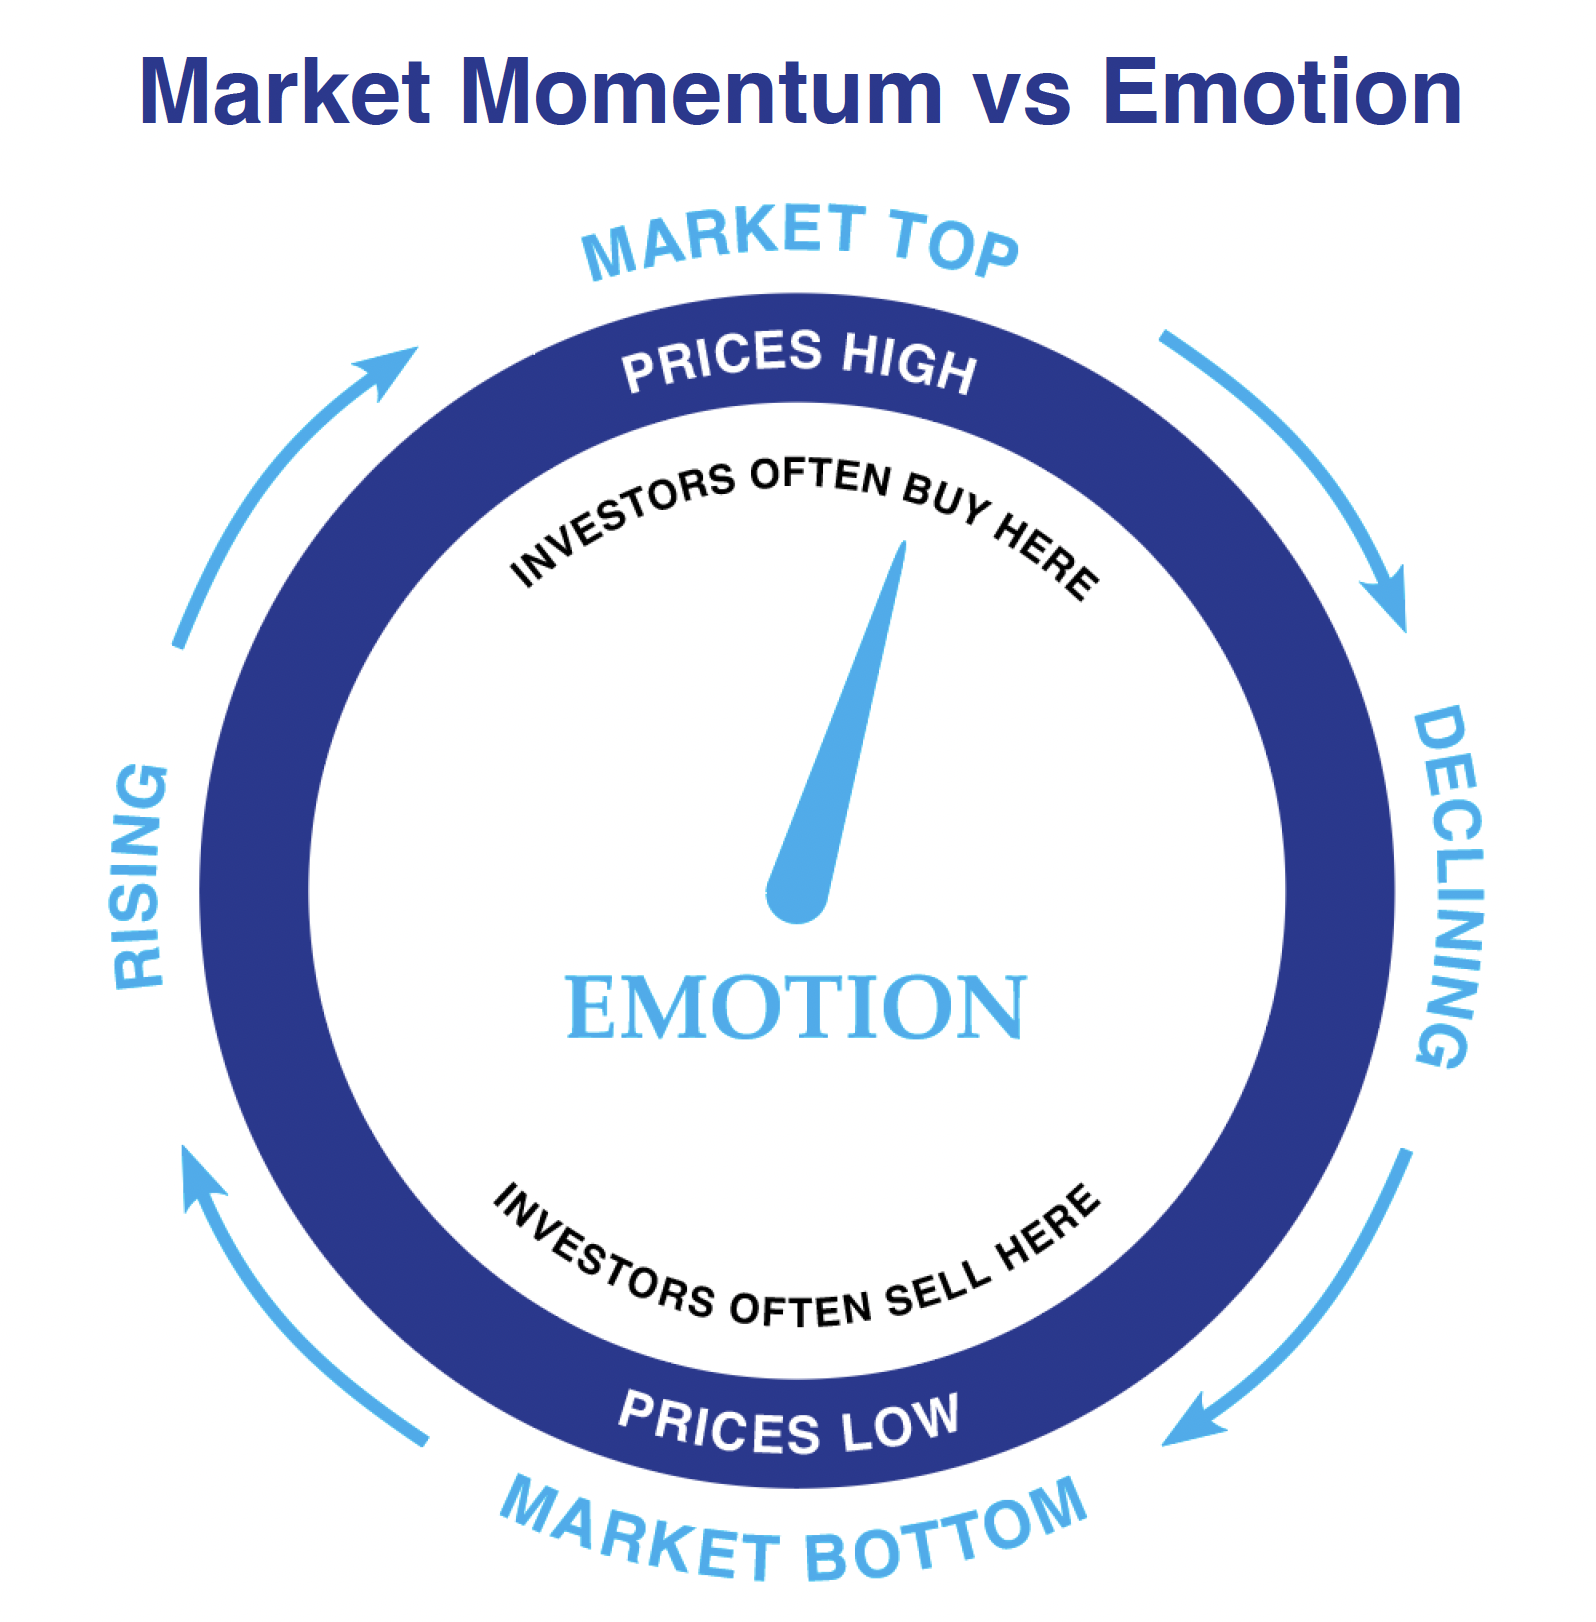
Investors have also been found to suffer from recency bias. This concept is the fallacy that the recent past is likely to repeat itself. The graphic below expresses the phenomenon of investors being emotionally driven by market movement. Investors make investment decisions based on market momentum even if there exist rational reasons to believe the market will turn around.
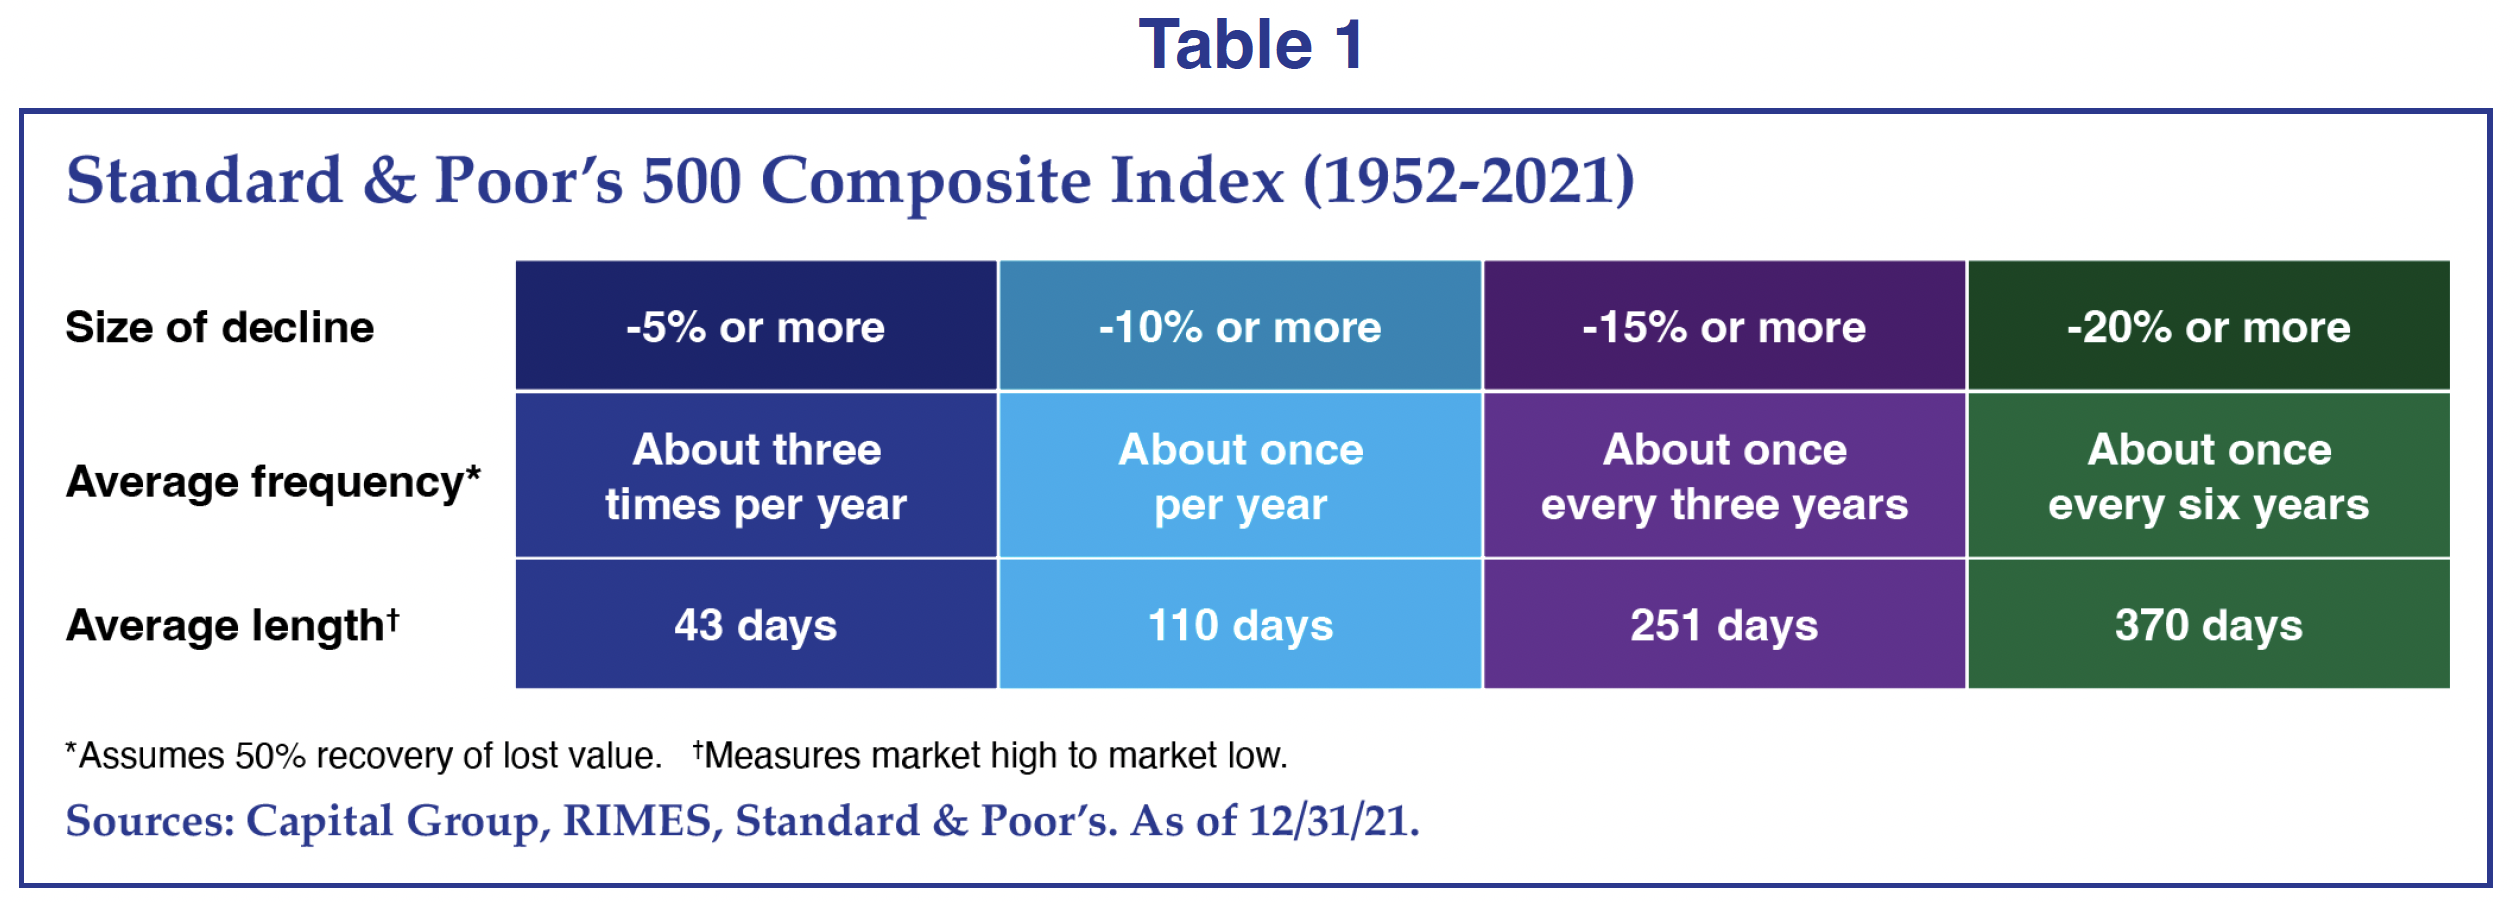
Market declines are an inevitable part of investing; timing the top and bottom of the market is nearly impossible because the factors that drive the direction of the market are extremely difficult to accurately predict. Looking at historical data helps individuals understand the various frequencies and durations of cyclical market movement. In Table 1, the various market declines of the S&P 500 composite index between 1951-2021 are highlighted. Various sizes of declines are shown with different lengths and frequencies.
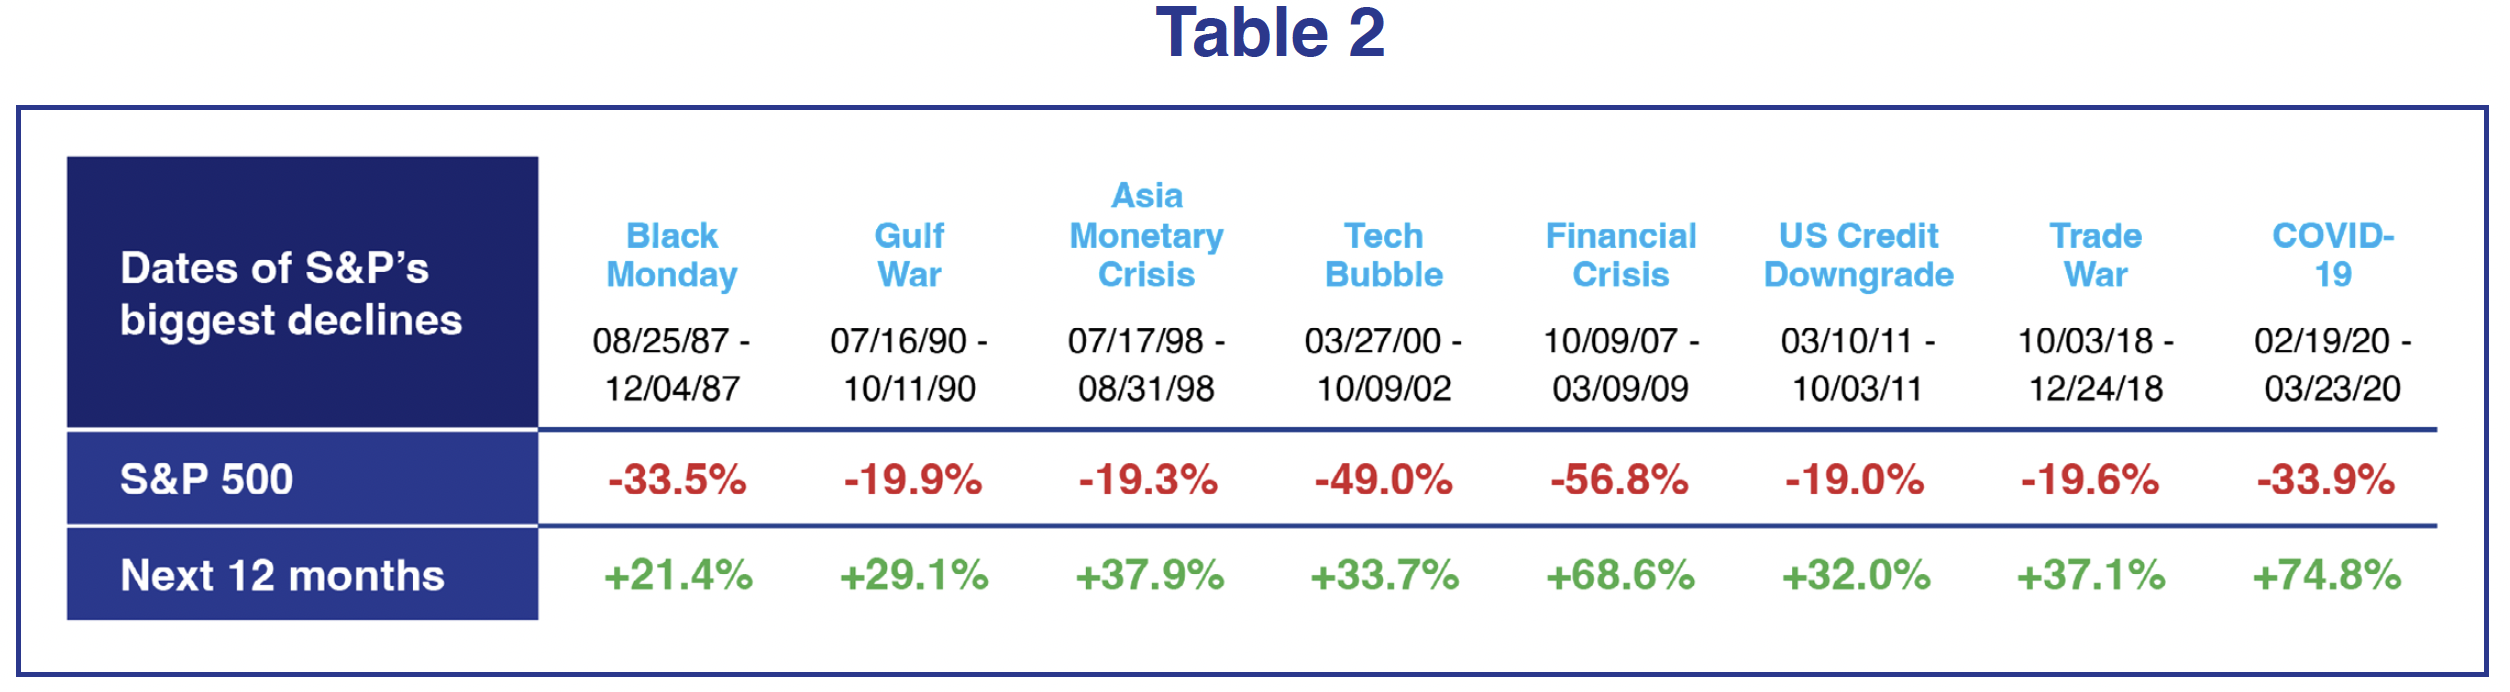
When drawdowns of -20% or more occur, consumer sentiment typically falls rapidly and stays low. A reallocation from equities to cash is driven by low consumer sentiment, and although seemingly innate, reallocation to cash during bear markets may not be an optimal solution. Over the last 40 years, there have been eight major bear market periods measured through the S&P 500 index. Following the bottom, the subsequent 12-month period resulted in strong recoveries as shown in Table 2.
Decisions made during market declines can have a lasting impact on the portfolio’s performance. During the Great Financial Crisis of 2007-2009, the S&P declined a total of -56.8%. The index rebounded +68.8% 12-months after the bottom.
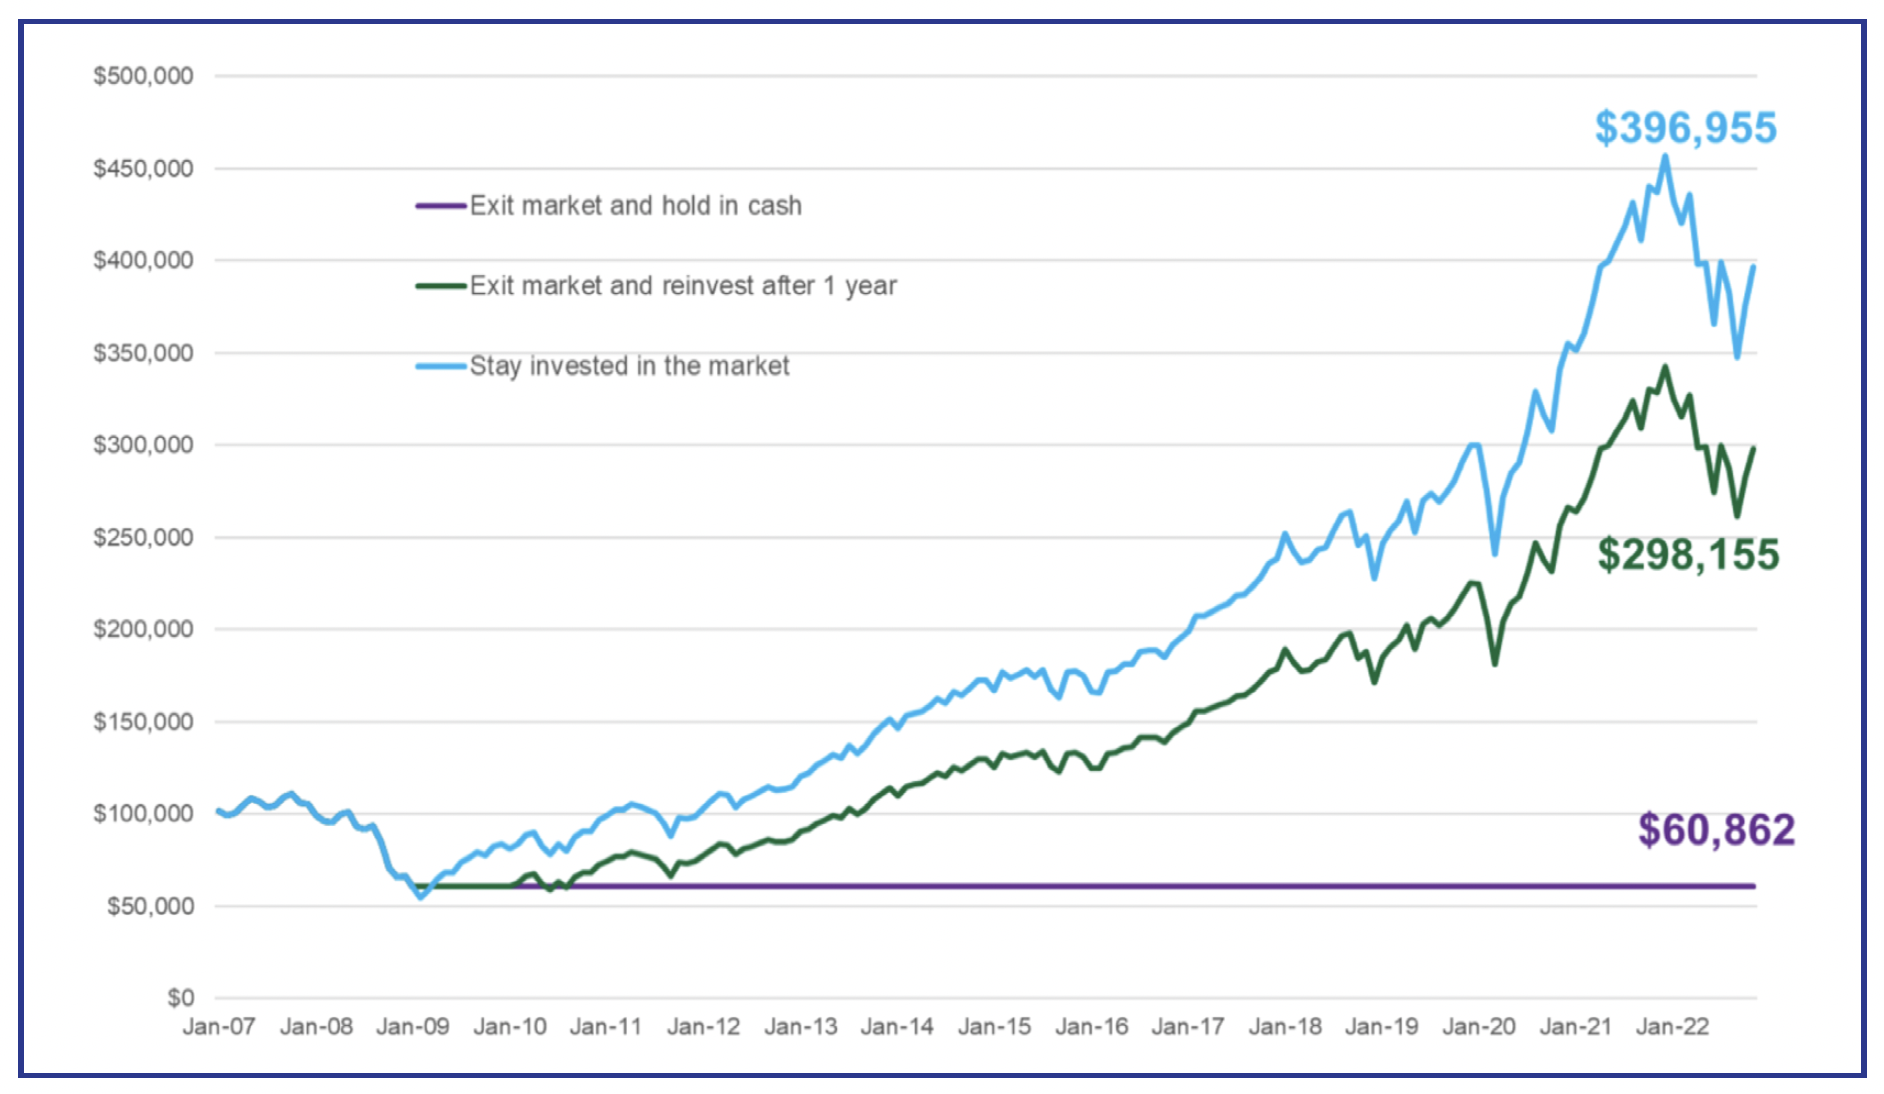
Hypothetically, if someone invested $100k in the S&P 500 at the beginning of 2007, their portfolio would experience a -56.8% decline. From there, we’ll consider three hypothetical scenarios: (1) liquidate stock investments and leave the proceeds in cash indefinitely; (2) move to cash for a year and then get back in the stock market; (3) remain invested in the stock market throughout the full time period. As illustrated by Chart 1, the outcomes of the three scenarios are vastly different; scenario 1 sees dismal results and scenario 2 lags scenario 3 by more than $100k as of the end of November 2022.
Source: Morningstar as of 12/31/22. Returns are principal only, not including dividends. Past performance does not guarantee future results. Index performance is for illustrative purposes only. You cannot invest directly in an index.
A decision made over a decade ago impacts the annualized returns even today. There are multiple studies that emphasize missing one, three, five, or ten of the best days in the market can have a significant impact on the overall portfolio’s return.
2022 was a tough year marked with major indices falling, inflation running hot, and supply chain issues still looming from the pandemic. These macroeconomic events do not change our underlying acuity about the markets. At Cornerstone, we
continue to take a disciplined and long-term approach while focusing on portfolio construction. There will be a time that a pullback occurs, followed by a bear market, and our decades-long experience has prepared us for those circumstances. Declines are an inevitable part of investing, those who stick to their process and remain patient rather than making rash decisions are more likely to be rewarded if the market recovers over time. An iQubed, Patience is a Virtue, written by my colleague, Mihir Saudagar emphasizes the importance of patience when investing. I want to leave you with a proverb that I think still holds true today: “timing the market is a fool’s game, but time in the market is your greatest natural advantage.”
Data from Callan Associates as of 11/30/2022. The market is represented by the S&P 500 Index. An investment cannot be made directly in an index. The data assumes reinvestment of income and does not account for taxes or transaction costs. This is for illustrative purposes only and not indicative any investment. Performance shown is past performance and not a guarantee of future results.
1Kahneman, Daniel, and Amos Tverskey. 1979. Prospect Theory. Econometrica (March): 263-292.