
May 15, 2018
“Diversification may preserve wealth, but concentration builds wealth.” - Warren Buffett, Berkshire Hathaway
In contrast to the quote above, Mr. Buffett has been oft cited saying that average investors should passively manage their assets via index funds. What happens, though, when investors think that they are taking the latter advice, but their portfolio is indeed more concentrated than they assume? It does not happen frequently, but over the past several decades, some prominent indexes have occasionally exhibited less diversification than a casual observer would expect. This history lesson is timely now because Chinese stocks are closing in on a 30% weighting in the MSCI Emerging Markets Index and come June will be almost 40% of that benchmark.The examples below are not an exhaustive history of periods of high index concentration and may not describe the future of the Chinese stock market, but we believe that they provide some perspective to consider.
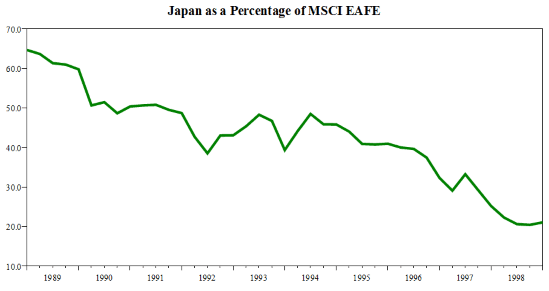
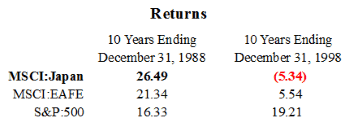
- At the end of 1988, Japan’s weighting in the MSCI EAFE maxed out at almost 65%. As the chart below shows, the country’s return in the index for the prior decade was over 26% per year. Japanese stocks contributed most of the EAFE’s outperformance relative to the S&P 500. For the following decade through December 31, 1998, Japan’s country return in the EAFE was less than -5% per year which vastly underperformed other international markets.
- Domestically, we experienced a similar phenomenon when the “Tech Bubble” in the early 2000s resulted in the Information Technology sector of the S&P 500 becoming almost 34% of the benchmark[1]. For the five years ending March 31, 2000, this sector had a total return of over 50%, far outstripping the second best performing sector[2]. Like the example above, the period following these strong returns failed to reproduce outsized returns relative to the overall market. From April 1, 2000 through March 31, 2005, technology stocks dropped 18%, underperforming the broader market which registered a -3% return. Technology has provided wind to the sail of the recent bull market; however, as of March 31, 2018, it stood at 25% of this benchmark.
[1] The Information Technology sector, as defined by Standard & Poor’s, was 33.6% of the S&P 500 as of March 31, 2000.
[2] The Financial Sector, which was the next best performing sector, returned 26.5% over the same period.
[3] For the decade ending 03/31/2018, the MSCI China Index has gained 6% per year whereas the MSCI Emerging Markets Index has earned 3% per year.
Sources: Standard & Poor’s and MSCI
Kevin is Cornerstone’s Chief Investment Officer and is involved with the firm’s Investment Policy and Strategic Planning committees. Kevin joined the company in 2000 after graduating from Lehigh University with a B.S. and M.S. in Economics and earned his CFA charter in 2005. Kevin supports many charitable causes and has established a donor advised fund to propagate his philanthropic interests. Kevin lives in Bethlehem with his cats Zola and Charlyne, enjoys woodworking, gardening, reading and travel. Kevin is the proud uncle to many nieces and nephews and loves spending time with and spoiling them.

Disclaimer Notice
This material is prepared by Cornerstone Advisors Asset Management, LLC (“Cornerstone”) and is not intended to be relied upon as a forecast, research or investment advice, and is not a recommendation, offer or solicitation to buy or sell any securities or to adopt any investment strategy. The opinions expressed are as of the published date indicated on the article and may change as subsequent conditions vary. The information and opinions contained in this material are derived from proprietary and nonproprietary sources deemed by Cornerstone to be reliable, are not necessarily all inclusive and are not guaranteed as to accuracy. As such, no warranty of accuracy or reliability is given and no responsibility arising in any other way for errors and omissions (including responsibility to any person by reason of negligence) is accepted by Cornerstone, its officers, employees or agents. This material may contain ‘forward looking’ information that is not purely historical in nature. Such information may include, among other things, projections and forecasts. There is no guarantee that any forecasts made will come to pass. Reliance upon information in this material is at the sole discretion of the reader.
Any accounting or tax advice contained in this communication is not intended as a thorough, in-depth analysis of specific issues, nor a substitute for a formal opinion, nor is it sufficient to avoid tax-related penalties.
The information is provided solely for informational purposes and therefore should not be considered an offer to buy or sell a security. Except as otherwise required by law, Cornerstone shall not be responsible for any trading decisions or damages or other losses resulting from this information, data, analyses or opinions or their use. Please read any prospectus carefully before investing.