Monthly Snapshots from our Analysts
2025
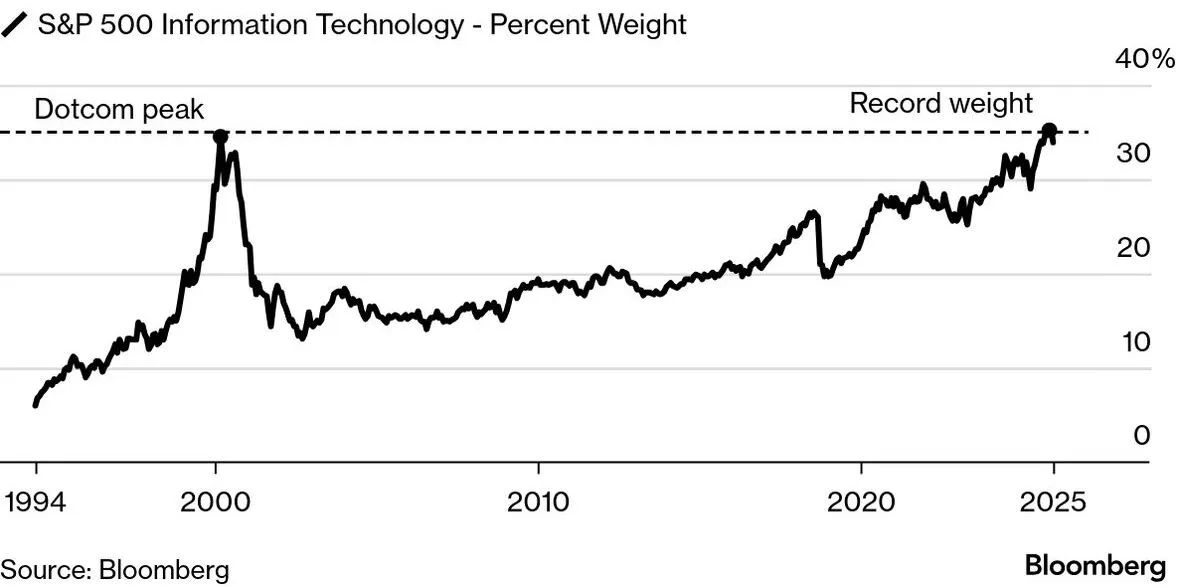
Tech Weight in S&P 500 Surges to Records
December 2025
The technology sector’s weight in the S&P 500 has risen to a new high, reflecting the growing economic importance and earnings power of today’s leading tech firms. Unlike prior cycles, much of this expansion has been driven by companies with established profitability and strong cash flows, though valuations have expanded alongside enthusiasm around AI and other growth drivers. As the pace and ultimate impact of AI adoption remain uncertain, thoughtful due diligence and diversification remain critical as investors assess longer‑term outcomes.

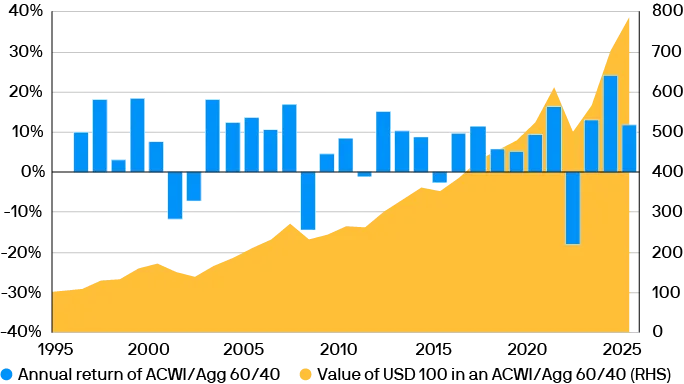
A Steady Exposure to Stocks and Bonds Has Stood the Test of Time Over the Last Three Decades
November 2025
A balanced 60/40 portfolio has proven resilient over the past three decades. Despite periods of volatility, the long-term trend shows steady growth, turning $100 into over $600 by 2025. Annual returns fluctuate, but the consistency of stocks and bonds together highlights the power of diversification.
Source: https://am.jpmorgan.com/us/en/asset-management/liq/insights/portfolio-insights/ltcma/

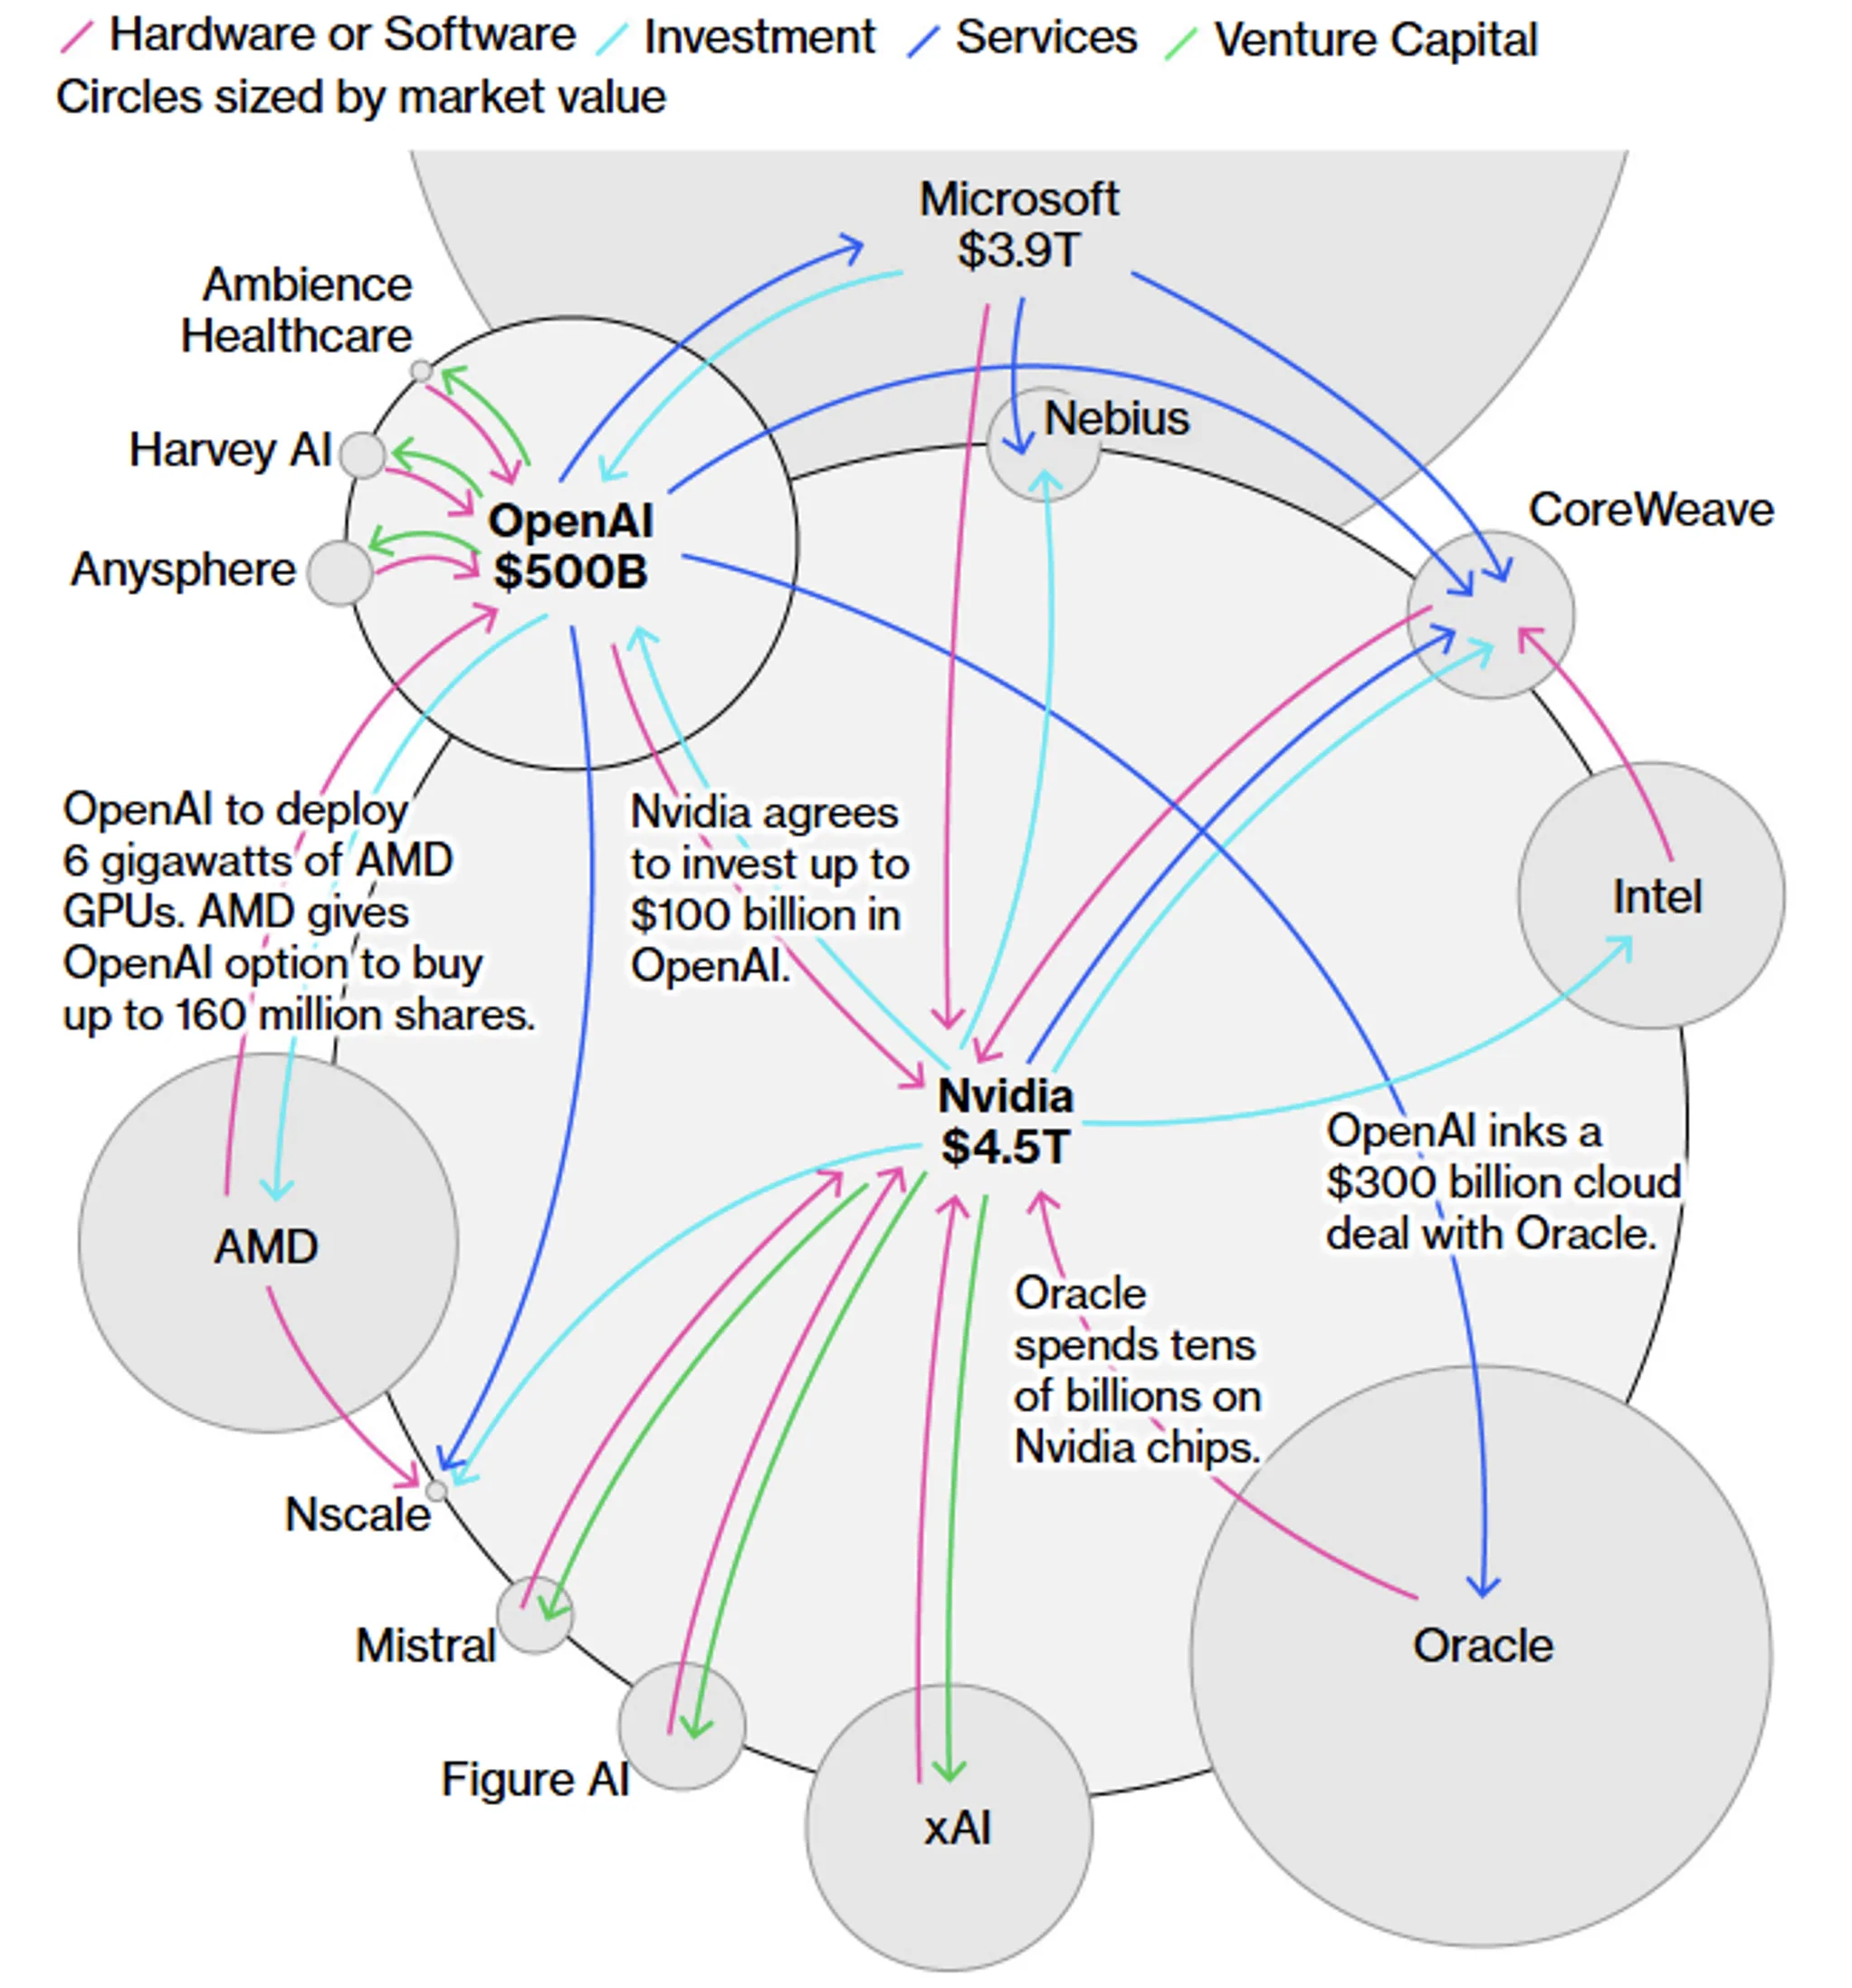
How Nvidia and OpenAI Fuel the AI Money Machine
October 2025
These days, it’s hard to open the news without seeing AI in the headlines. Central to these conversations are names like Nvidia and OpenAI. As capital expenditures for AI continue to swell, investments between these companies are growing increasingly interconnected.


Least Expensive Funds Attract Biggest Inflows
September 2025
Year to date ETF charging 0–10 basis points have captured the lion’s share of 2025 inflows at $323.9 billion. This trend reflects a broader shift from active to passive management, as investors increasingly prioritize cost efficiency and index-based strategies over higher-fee, actively managed alternatives.

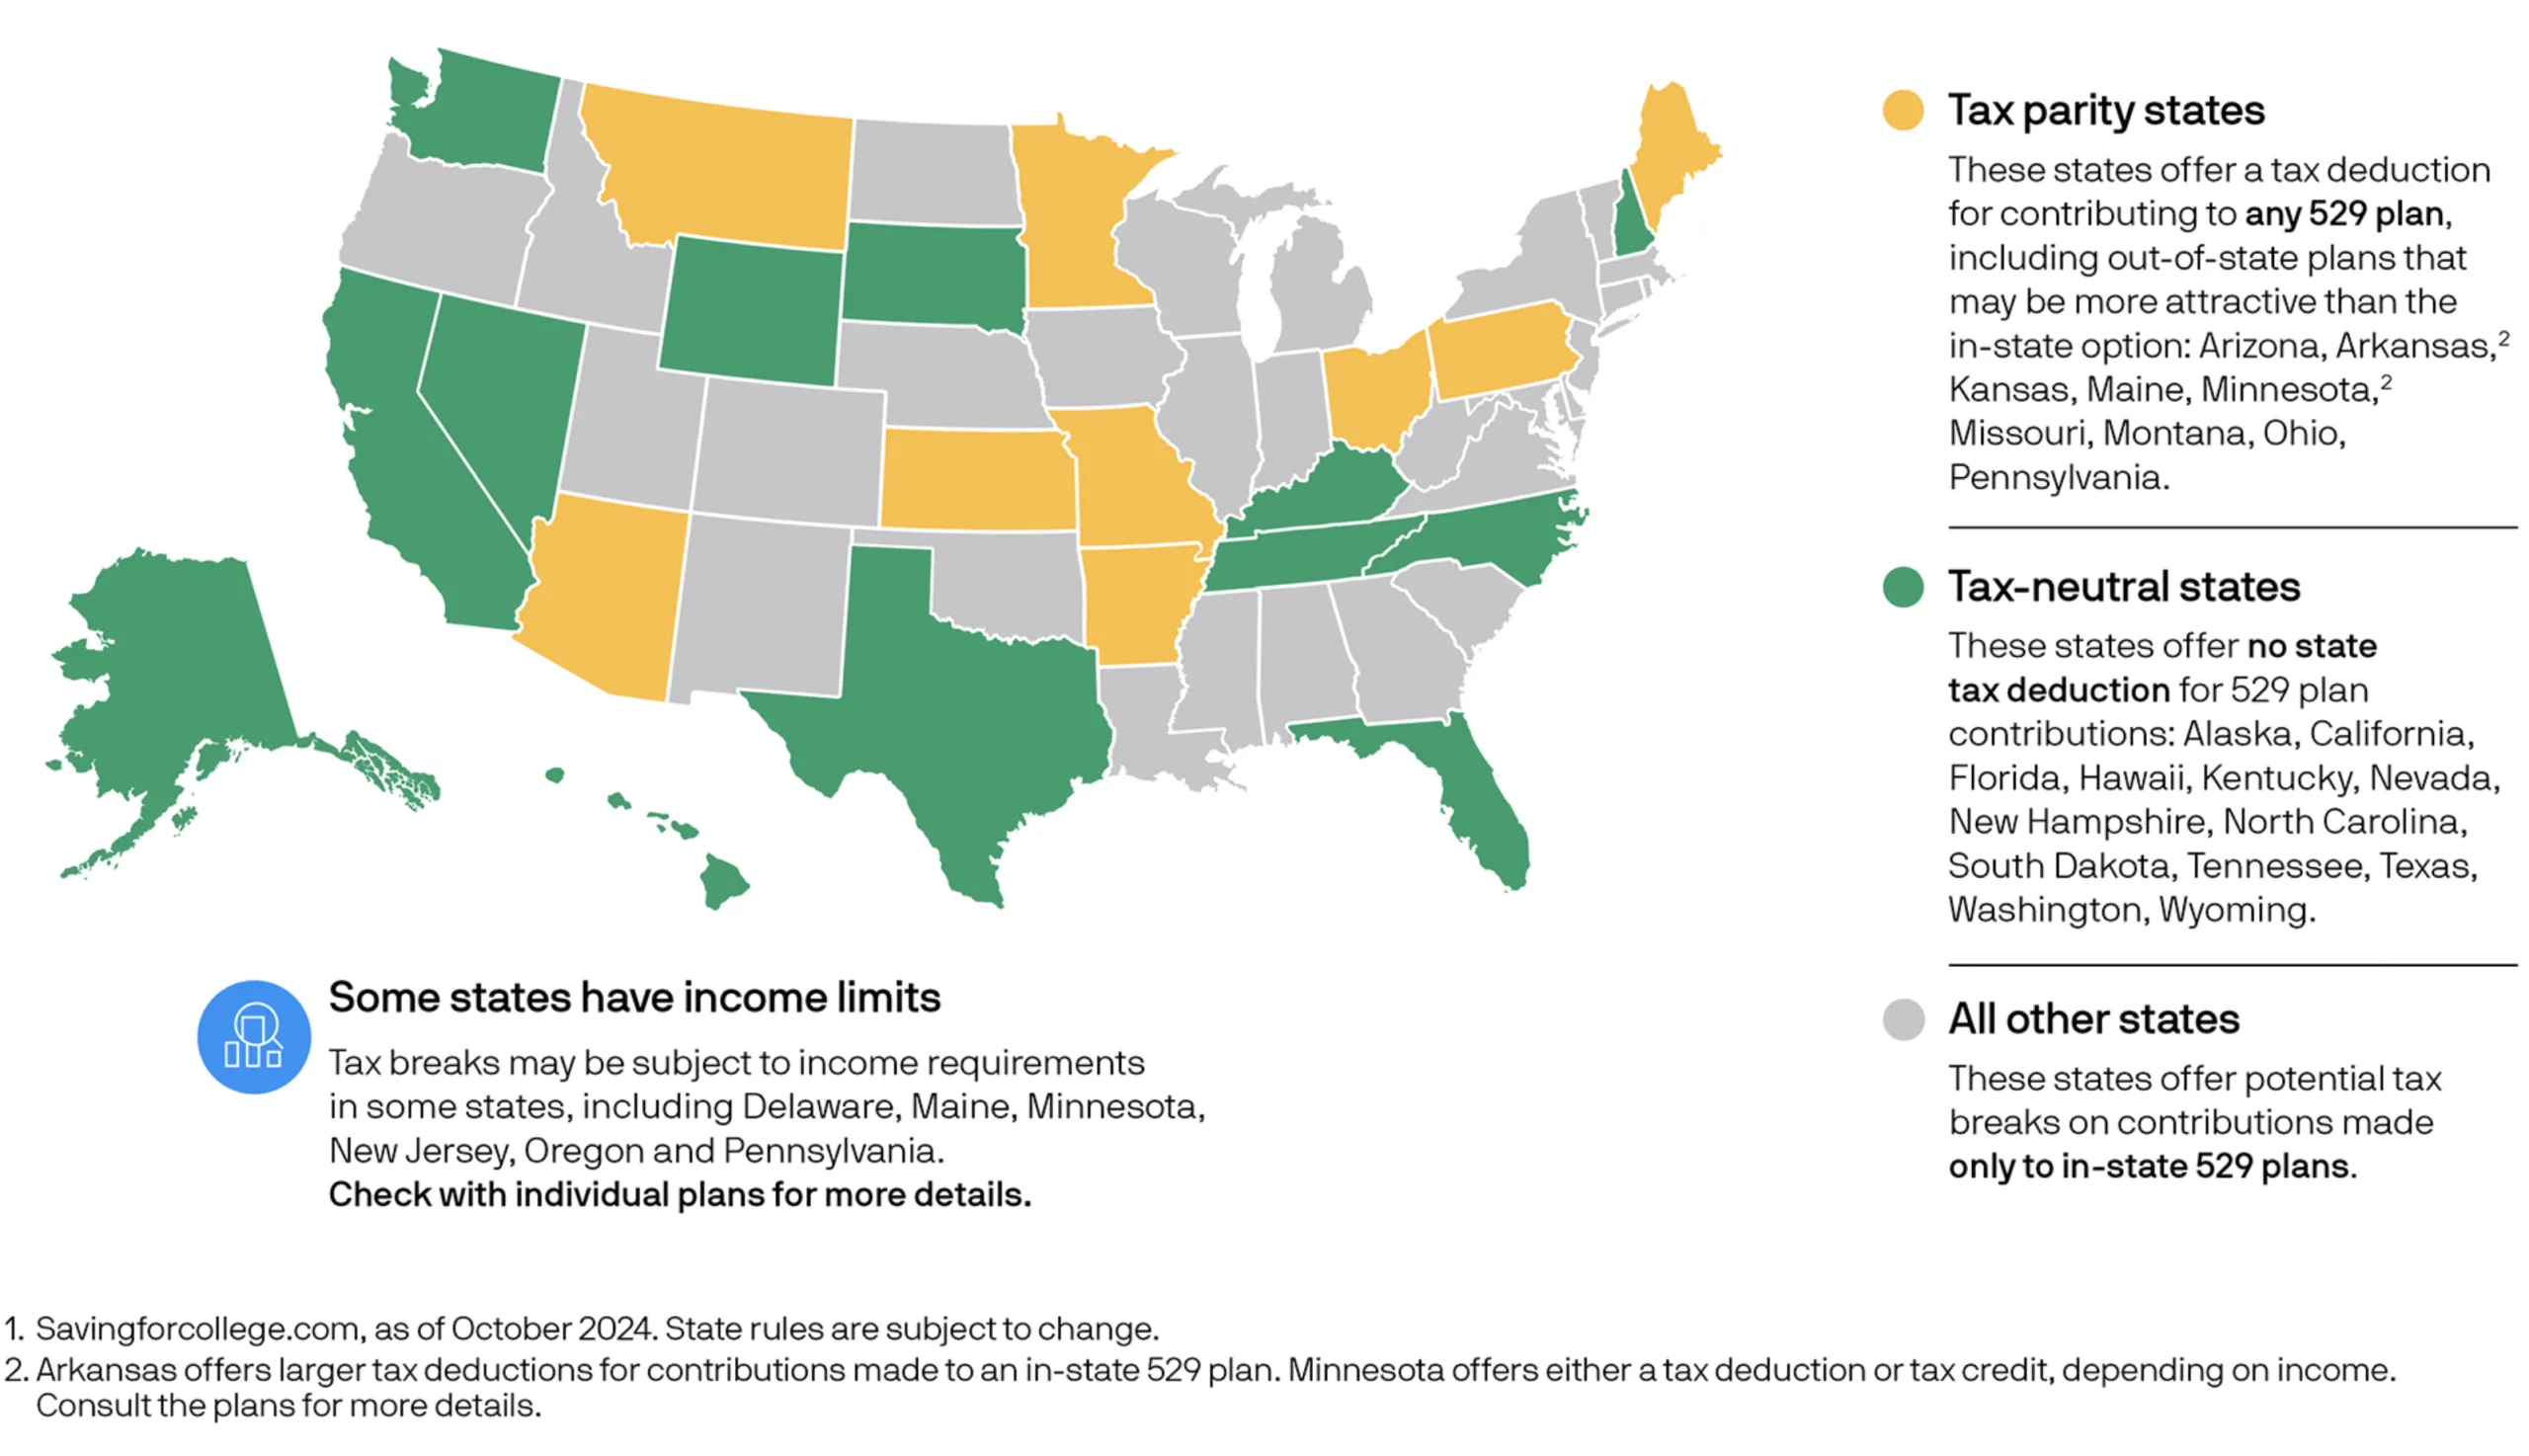
529 Plan State Tax Benefits by State
August 2025
This map illustrates the state tax treatment of 529 plans by state. As we noted in our recent blog post summarizing the impact of the “Big, Beautiful Bill” on retirement savings, the scope of expenses eligible for payment using 529 plan assets will be expanded. In this map, states in yellow have the most advantageous state tax treatment, providing a tax deduction for 529 plan contributions.

Imputation Source for the Commodities and Services Price
July 2025
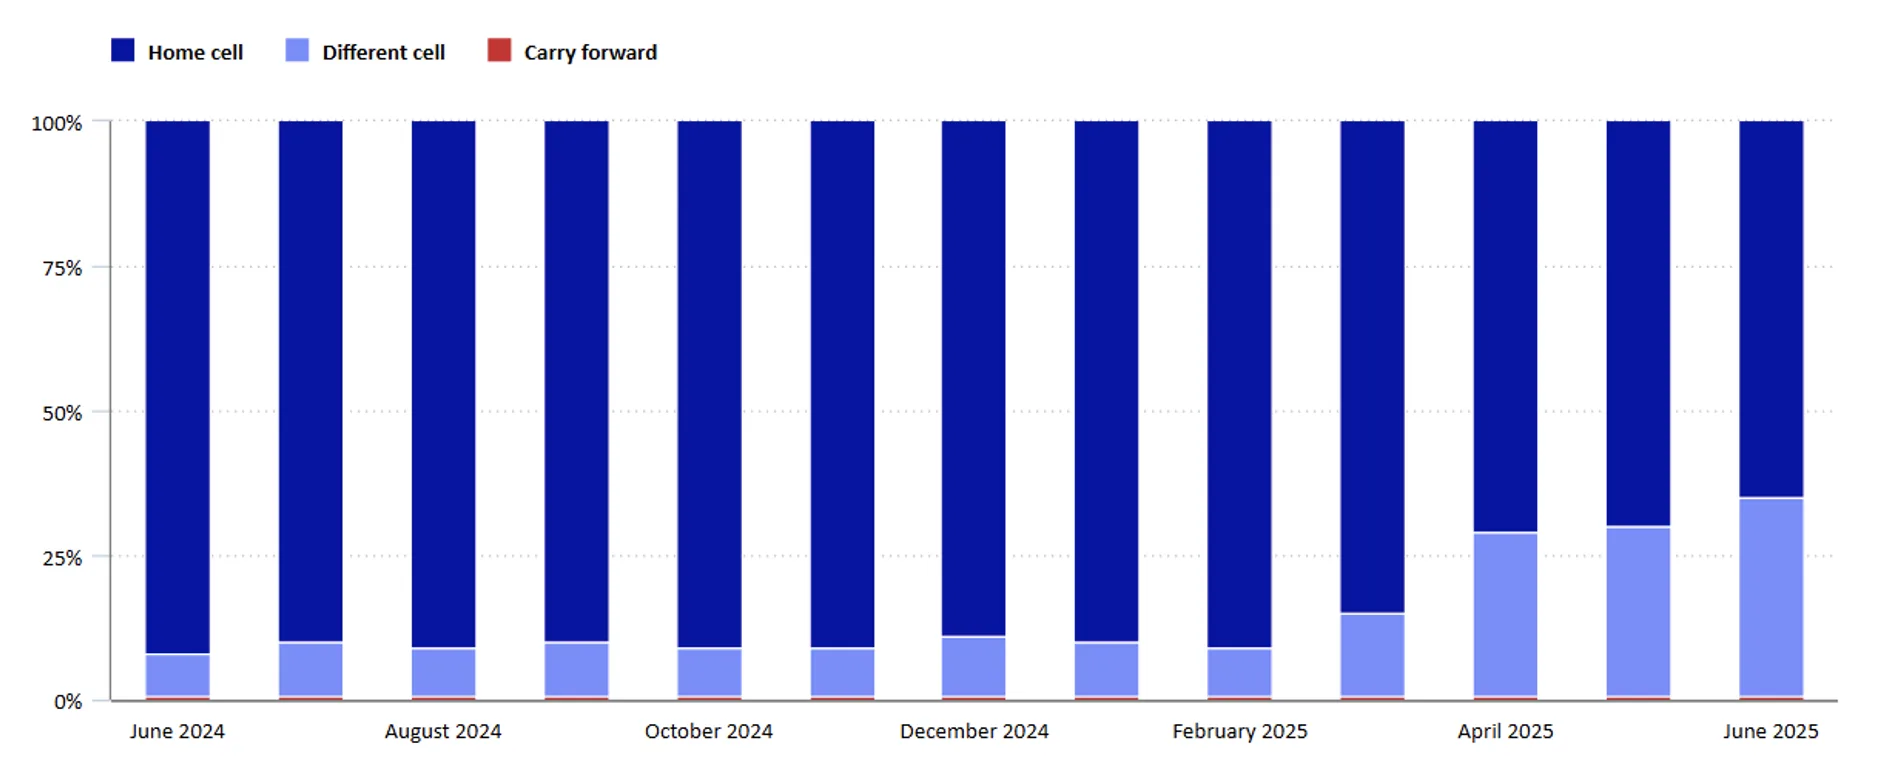
This chart shows the sources used to calculate the commodities and services component of CPI. The light blue bar shows the percentage of prices that must be calculated from the same item in different geographic areas or a related item in the same geographic area. This is known as “different cell” imputation. This can be contrasted with calculations using prices of the same item in the same geographic area, represented by the dark blue bar. The percentage of different cell imputation has increased since a year ago, from 8% in June 2024 to 35% in June 2025, reflecting a reduction in the Bureau of Labor Statistics’ data collection beginning in April. While not expected to impact national CPI calculations, the Bureau reports it “may increase the volatility of subnational or item-specific indexes.

Index of Global Tightening or Easing
June 2025
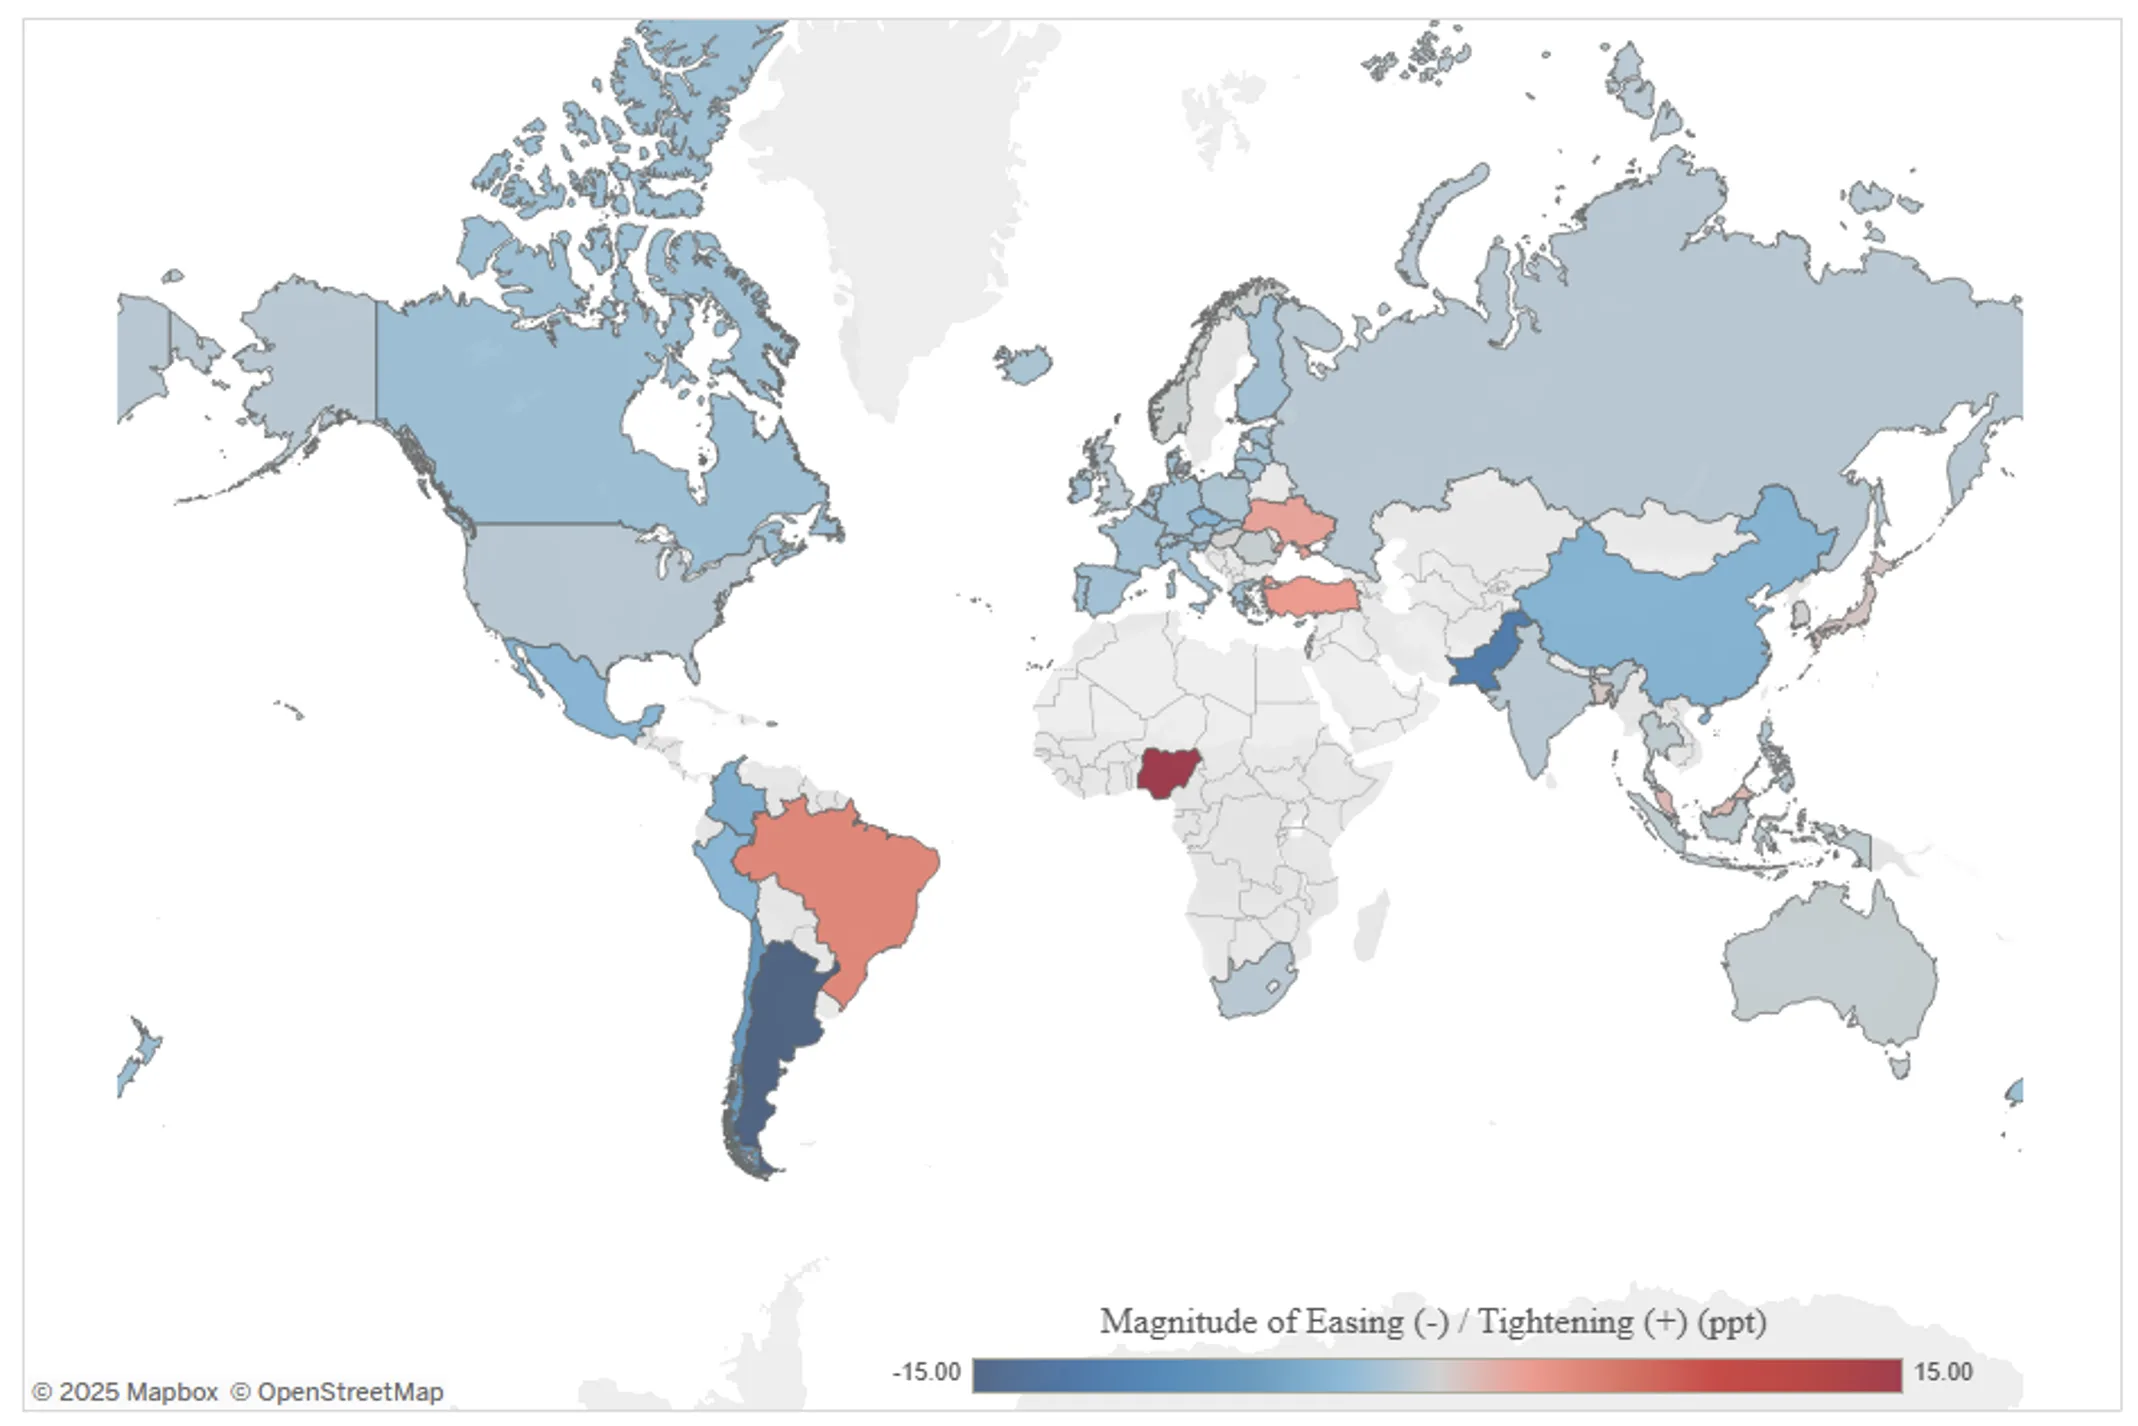
Monetary policy around the world has been making headlines as global central banks evaluate uncertain trade policies and economic outlooks. With a few exceptions in countries where rates have been increasing, shown in red, the interest rate environment has largely consisted of easing or unchanging policy.
Source: https://www.cfr.org/tracker/global-monetary-policy-tracker

Annual Pension Risk Transfer Market Size
May 2025
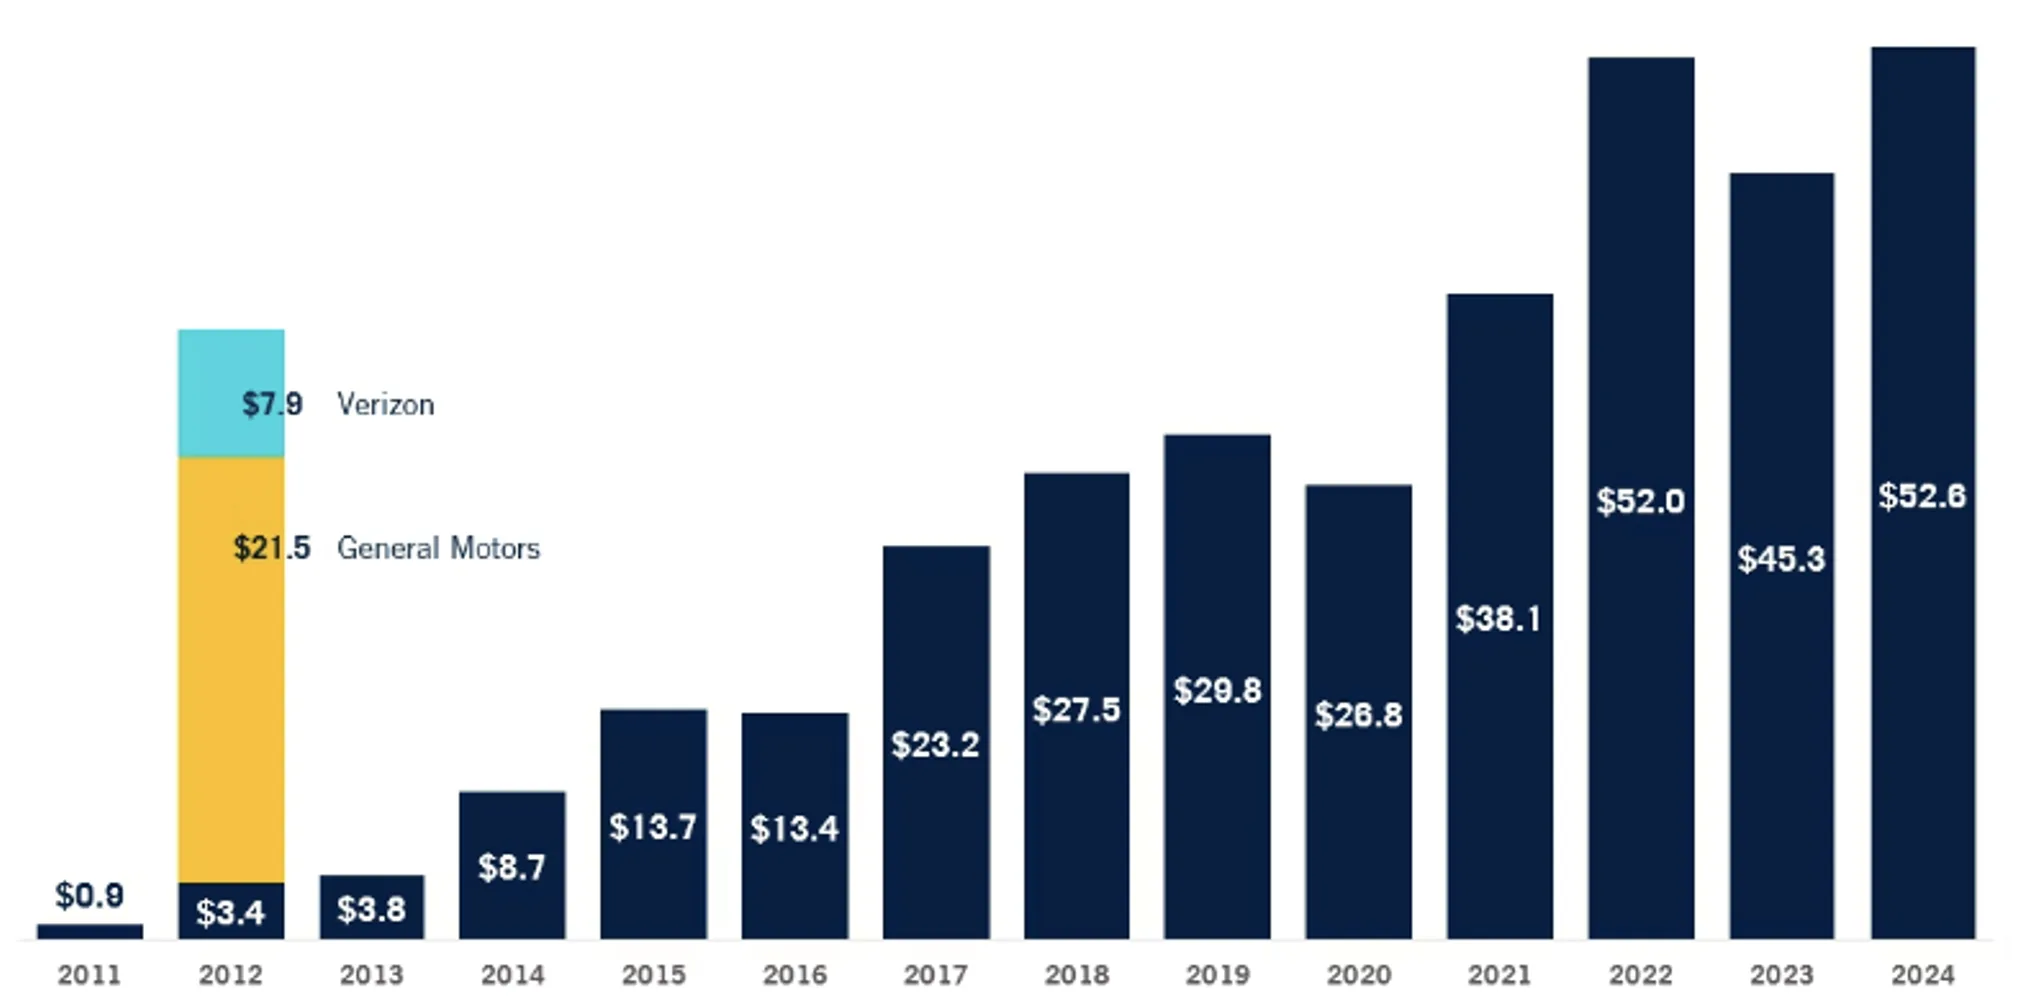
The Pension Risk Transfer market has grown substantially in the last decade, fueled by demand for pension plan termination solutions. Opportunity often breeds innovation in the financial marketplace, and institutions have certainly risen to the challenge. In these transactions, insurers effectively offer an opportunity to transfer risk and liability from pension plan sponsors to themselves.
Source: LIMRA Group Annuity Risk Transfer Survey, 4Q 2024 and Prudential calculations.
Based on sales of single-premium buy-outs and buy-ins in billions of dollars.


U.S. Import Dependence on China by State
April 2025
In 2024, the U.S. imported $438.9 billion from China totaling 13.4% of all goods imported. This chart illustrates the percentage share of each U.S. state’s imports that come from China, based on data from the U.S. International Trade Administration (2024). This import reliance is particularly significant in the context of the Trump administration’s reintroduced tariffs on Chinese goods in 2024, which aim to reduce the U.S. trade deficit and pressure China on trade practices. These tariffs, targeting sectors such as electronics, machinery, and consumer goods, are likely to disproportionately affect states with higher import shares, especially those deeply tied to Chinese supply chains. in 2024 China supplied 41% of all U.S. consumer electronics imports, making the tech sector especially vulnerable to the economic ripples of these tariffs.
Source: https://www.voronoiapp.com/markets/Nevada-Depended-Most-on-Chinese-Imports-in-2024—4530


Giving Sectors Over a 40-year Period
March 2025
Charitable giving comes from multiple sources, including individuals, foundations, bequests, and corporations, each playing a role in the shifting giving landscape shown above. Changes in directed philanthropy are influenced by many factors such as economic conditions, global events like pandemics & natural disasters, and shifting social priorities. These trends indicate a broadening in charitable efforts over the past 40 years, with more focus on societal needs beyond traditional religious giving.


Quarterly Current Yields and Average Yield over the Last Ten Years for Private Credit and Public Credit Indices
February 2025
Private credit, or lending by non-bank institutions, has grown significantly in recent years. As banking regulations have tightened and bank lending has declined, businesses in need of capital have increasingly turned to the private markets, which provide not only more flexible underwriting but also more customizable terms. Increased private equity activity, which often requires loans for buyouts, has also driven demand for private lending. Simultaneously, investors in search of higher fixed income returns have been more than willing to provide the funding.
As assets have poured into these strategies, the spread between private credit and publicly traded leveraged loans has declined, reflecting a lower premium offered to investors that are taking on illiquidity and complexity. This tightening of spreads, coupled with significant underwriting differences between funds, highlights the critical role of manager due diligence and risk evaluation in portfolio construction.
Source: https://www.blackrock.com/us/financial-professionals/insights/the-growth-in-private-credit


Percent of U.S. Individual Charitable Giving Going to Private Foundations and DAFs
January 2025
There has been a shifting narrative as to where individuals have been directing their gifting. In 2008, donor- advised funds (DAFs) accounted for 4% of individual charitable gifting versus 13% going toward private foundations. Over the last 15 years, the percentage of individuals gifting to donor advised funds has increased to 27%, whereas charitable gifts to private foundations stayed relatively flat at 14%.
Our comparison of DAFs and private foundations illustrates some of the unique features of each; benefits of the DAF include simplicity of administration as well as tax-free growth of assets. Private foundations may also be interested in this issue of Independent Insights, where we discuss how opening a DAF alongside of the main portfolio can provide spending stability. If you would like to learn more about DAFs and how they can help with your own philanthropic efforts or private foundation’s spending policy, please contact Stephen Link, our Director of Philanthropic Services.
Source: https://inequality.org/article/donor-advised-funds-quarter-of-charitable-giving/


