Monthly Snapshots from our Analysts
2026
U.S. Manufacturing Momentum Continues to Build
August 2026
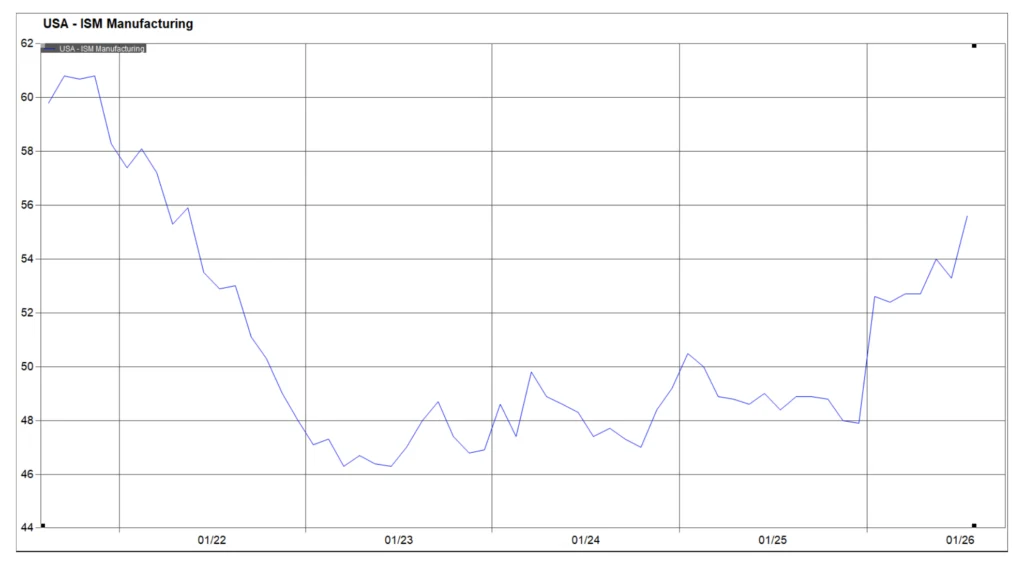
The broader U.S. manufacturing sector is demonstrating a turnaround, breaking out from a period of contraction. An ISM index above 50 means the manufacturing sector is expanding, while a reading below 50 means it’s shrinking. July’s reading is the highest since 2022, after seven straight months of expansion. Every internal indicator is on the rise, with the exception of prices paid, signaling robust structural health across the broader industrial base.
A massive driver of underlying demand is the growth in cloud revenue backlog. Hyperscalers are heavily increasing capital expenditure on compute infrastructure to support AI-driven demand. Defense manufacturing is experiencing a similar secular demand impulse; census data indicates aggregate defense orders and shipments have surged by ~60% since 2020, particularly over the past 1.5 years. Beyond sector-specific growth, recent federal tax- and fiscal- policies continue to act as a significant catalyst for domestic manufacturing and capacity expansion.
Source: Factset https://www.ismworld.org/supply-management-news-and-reports/reports/ism-pmi-reports/pmi/august/

Russell Reconstitution Reshaped Benchmark Performance
July 2026
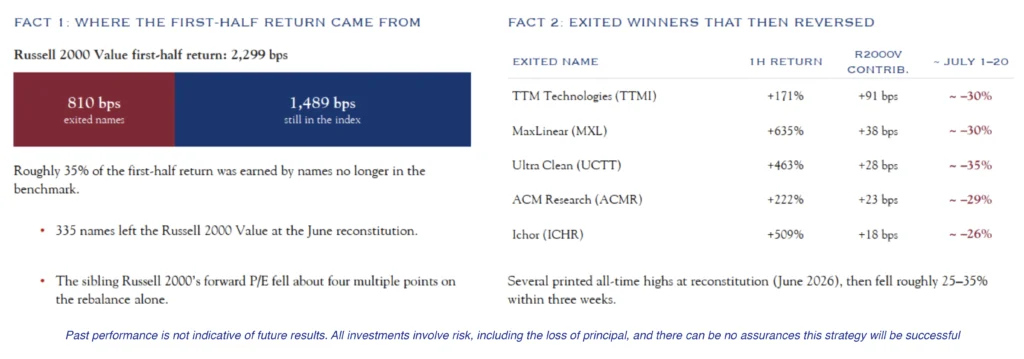
The end-of-June reconstitution of Russell indexes materially changed the composition of the growth- and value- style benchmarks across market capitalizations. Notably, while the Russell 2000 Value returned 23.0% in the first half of the year, 35% of that gain came from contributors that were then removed at reconstitution. Shortly after leaving the index, many of those contributors declined 25-35%. As a result, the benchmark retained the historical benefit of those gains while largely avoiding the subsequent reversal.
Managers with valuation or quality discipline may have lagged by avoiding the strongest speculative winners, while managers that retained exited names could have been penalized again during the July reversal. More broadly, company migrations between growth and value, rising market-cap breakpoints, and changing sector and quality exposures altered the indexes’ investment characteristics. The reconstitution should therefore be treated as an important benchmark-composition event when reviewing short-term active manager results, as temporary distortions created by index changes can obscure manager skill; instead, managers should be evaluated over a full market cycle.
Source: Data as of March 31, 2026 Silvercrest Asset Management Group; FactSet; FTSE Russell; Jefferies

The IPO Roller Coaster
June 2026
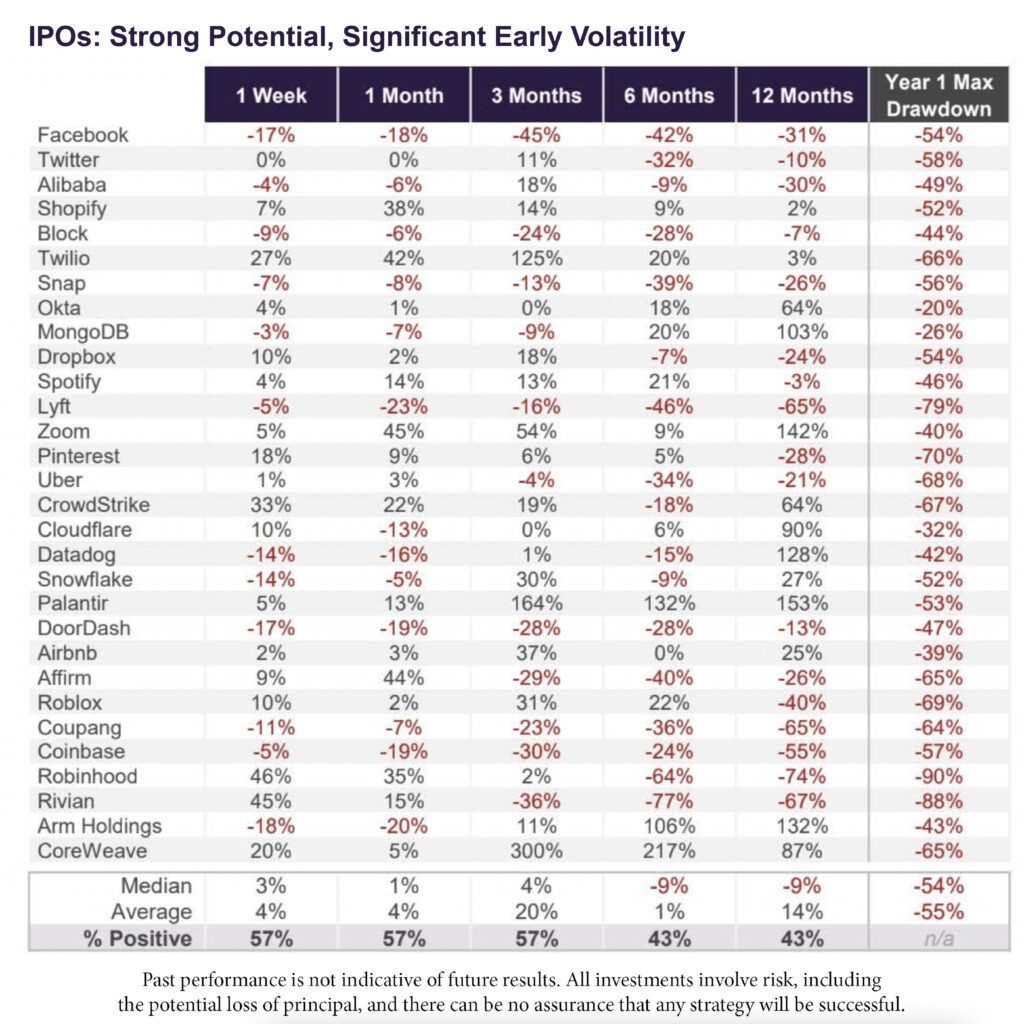
High-profile IPOs often come to market with strong momentum and investor excitement, but the first year as a public company tends to be much more volatile than many expect.
Research from Truist's CIO Keith Lerner shows that, on average, large IPOs experience a peak-to-trough decline of about 55% within their first year of trading. While some companies go on to deliver strong long-term returns, the path early on is rarely smooth. This pattern reflects a combination of elevated starting valuations, shifting investor expectations, and increased share supply following lockup expirations. Even companies that ultimately succeed can see meaningful drawdowns before stabilizing.
The takeaway for investors is simple: early performance after an IPO can be unpredictable, and short-term volatility is common. Strong long-term outcomes often require patience and a willingness to look through near-term swings rather than reacting to early price moves.
Tech is Dominant, But Not as Dominant as Sectors of Yore
May 2026
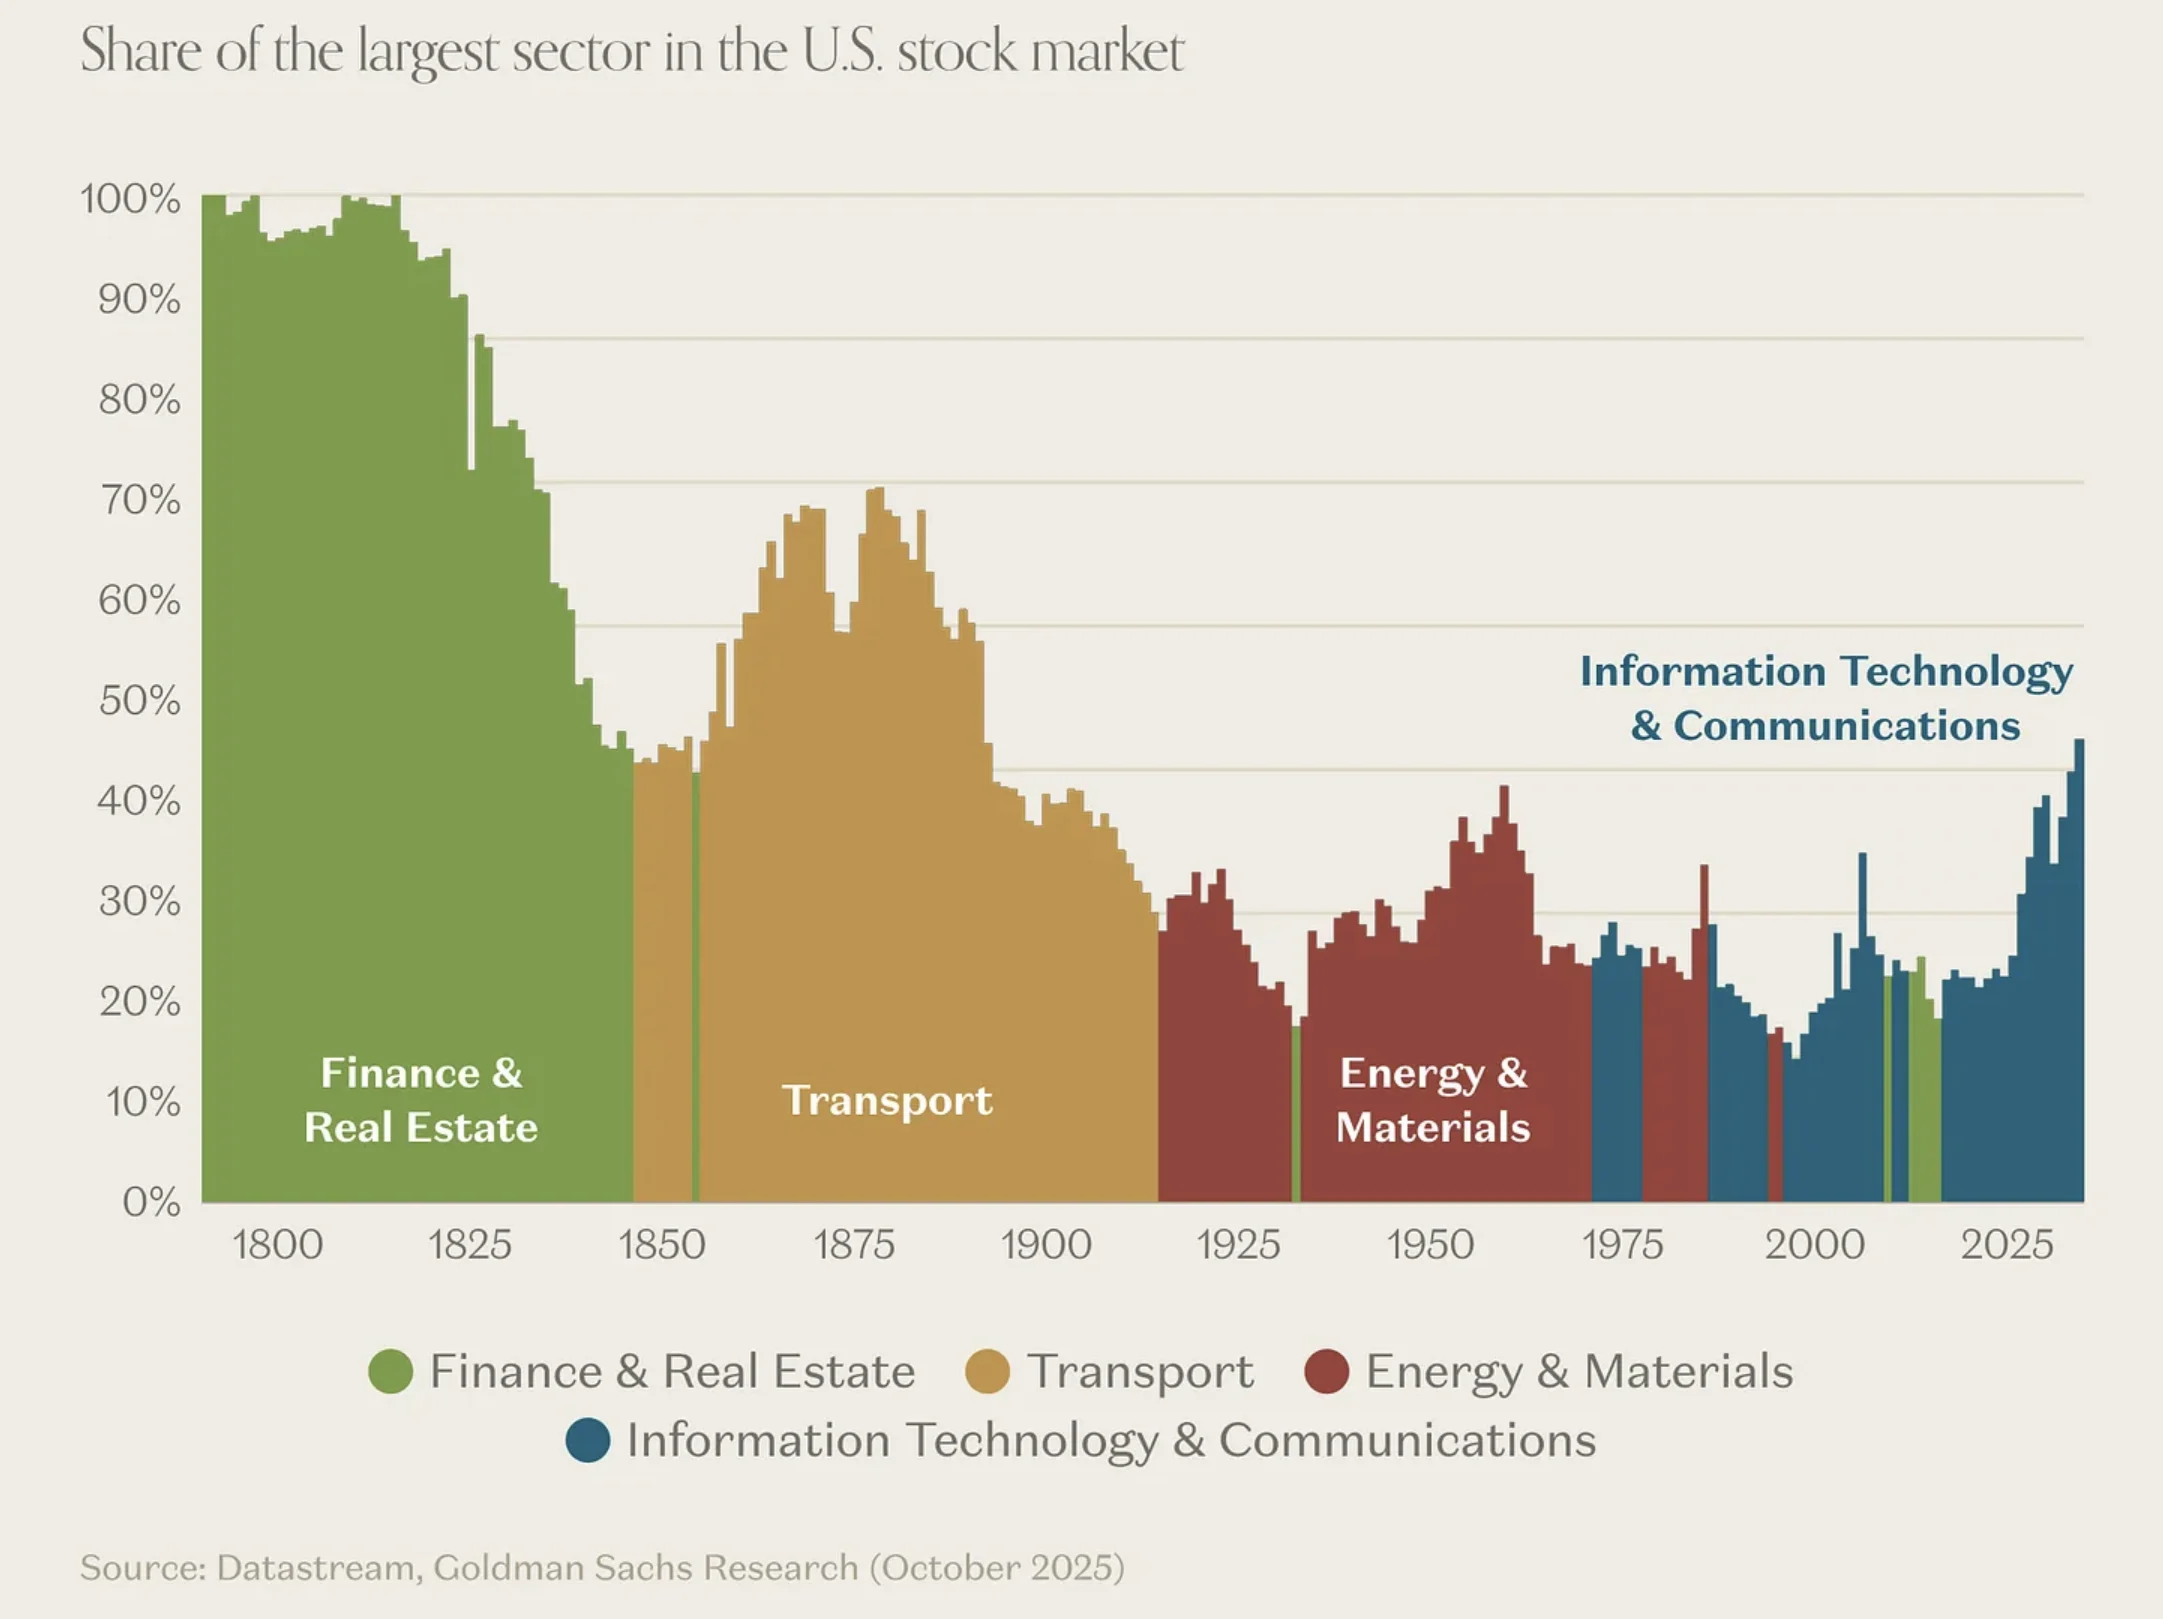
Over the past two centuries, each era of American economic transformation has produced a dominant sector. Finance & Real Estate built the young nation's foundation, as capital formation and land development underpinned expansion. Railroads drove Transportation to nearly 70% of the entire market, becoming the backbone of industrialization. Energy & Materials powered the industrial and post-war boom through much of the 20th century. Today, Information Technology & Communications leads the way, reflecting the transition to a digital, innovation-led economy. Yet today's tech dominance – around 45% of the market – is actually more modest than the near-monopolies of sectors past, a reflection of a more mature, diversified economy. The takeaway for investors: sector leadership is never permanent. Every dominant industry eventually matures or is disrupted by something new.
Source: https://www.a16z.news/p/charts-of-the-week-software-ate-the?utm_source=publication-search

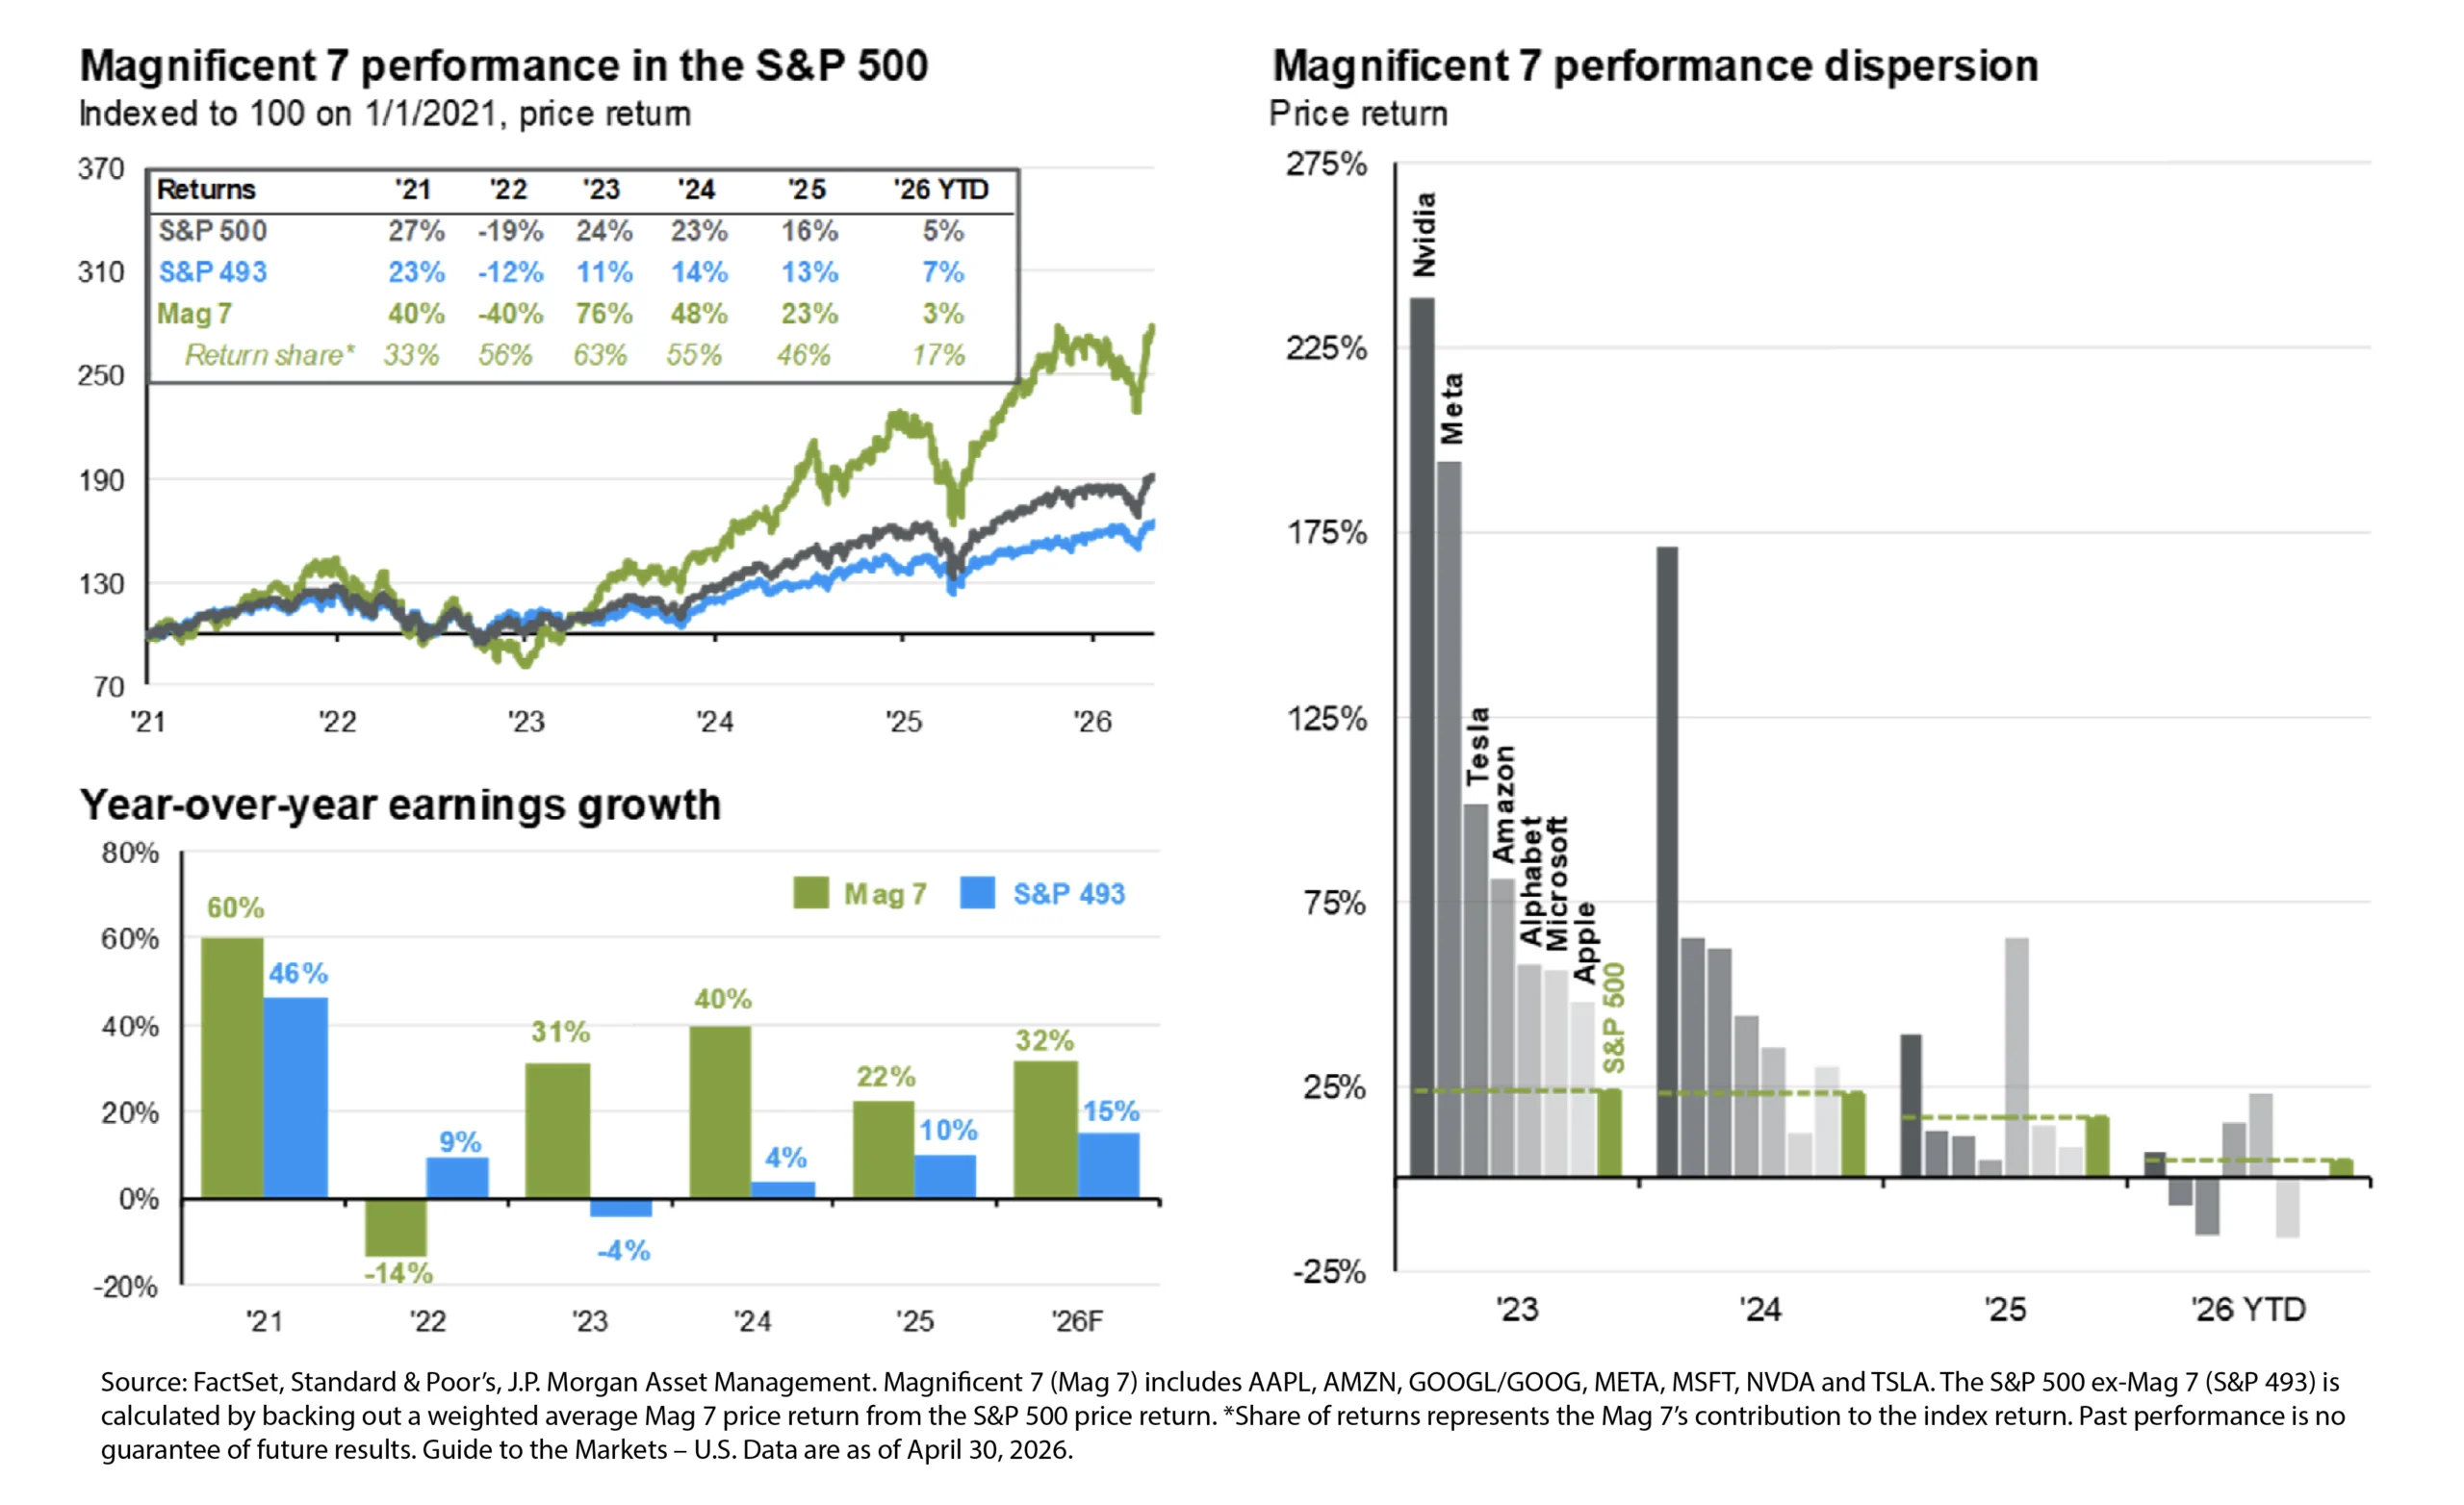
Magnificent 7: Performance, Earnings, and Dispersion
April 2026
A large share of recent market gains has been driven by the Magnificent 7, supported by stronger earnings growth in this subset of companies rather than broad growth across all stocks. Yet at the same time, performance within this group has become increasingly uneven, with strong results from a few companies masking weaker performance among others. This concentration, as well as the dispersion seen even within these large stocks, highlights the importance of diversification and thoughtful investment decisions, even when overall market returns appear strong.
Source: https://am.jpmorgan.com/us/en/asset-management/adv/insights/market-insights/guide-to-the-markets/

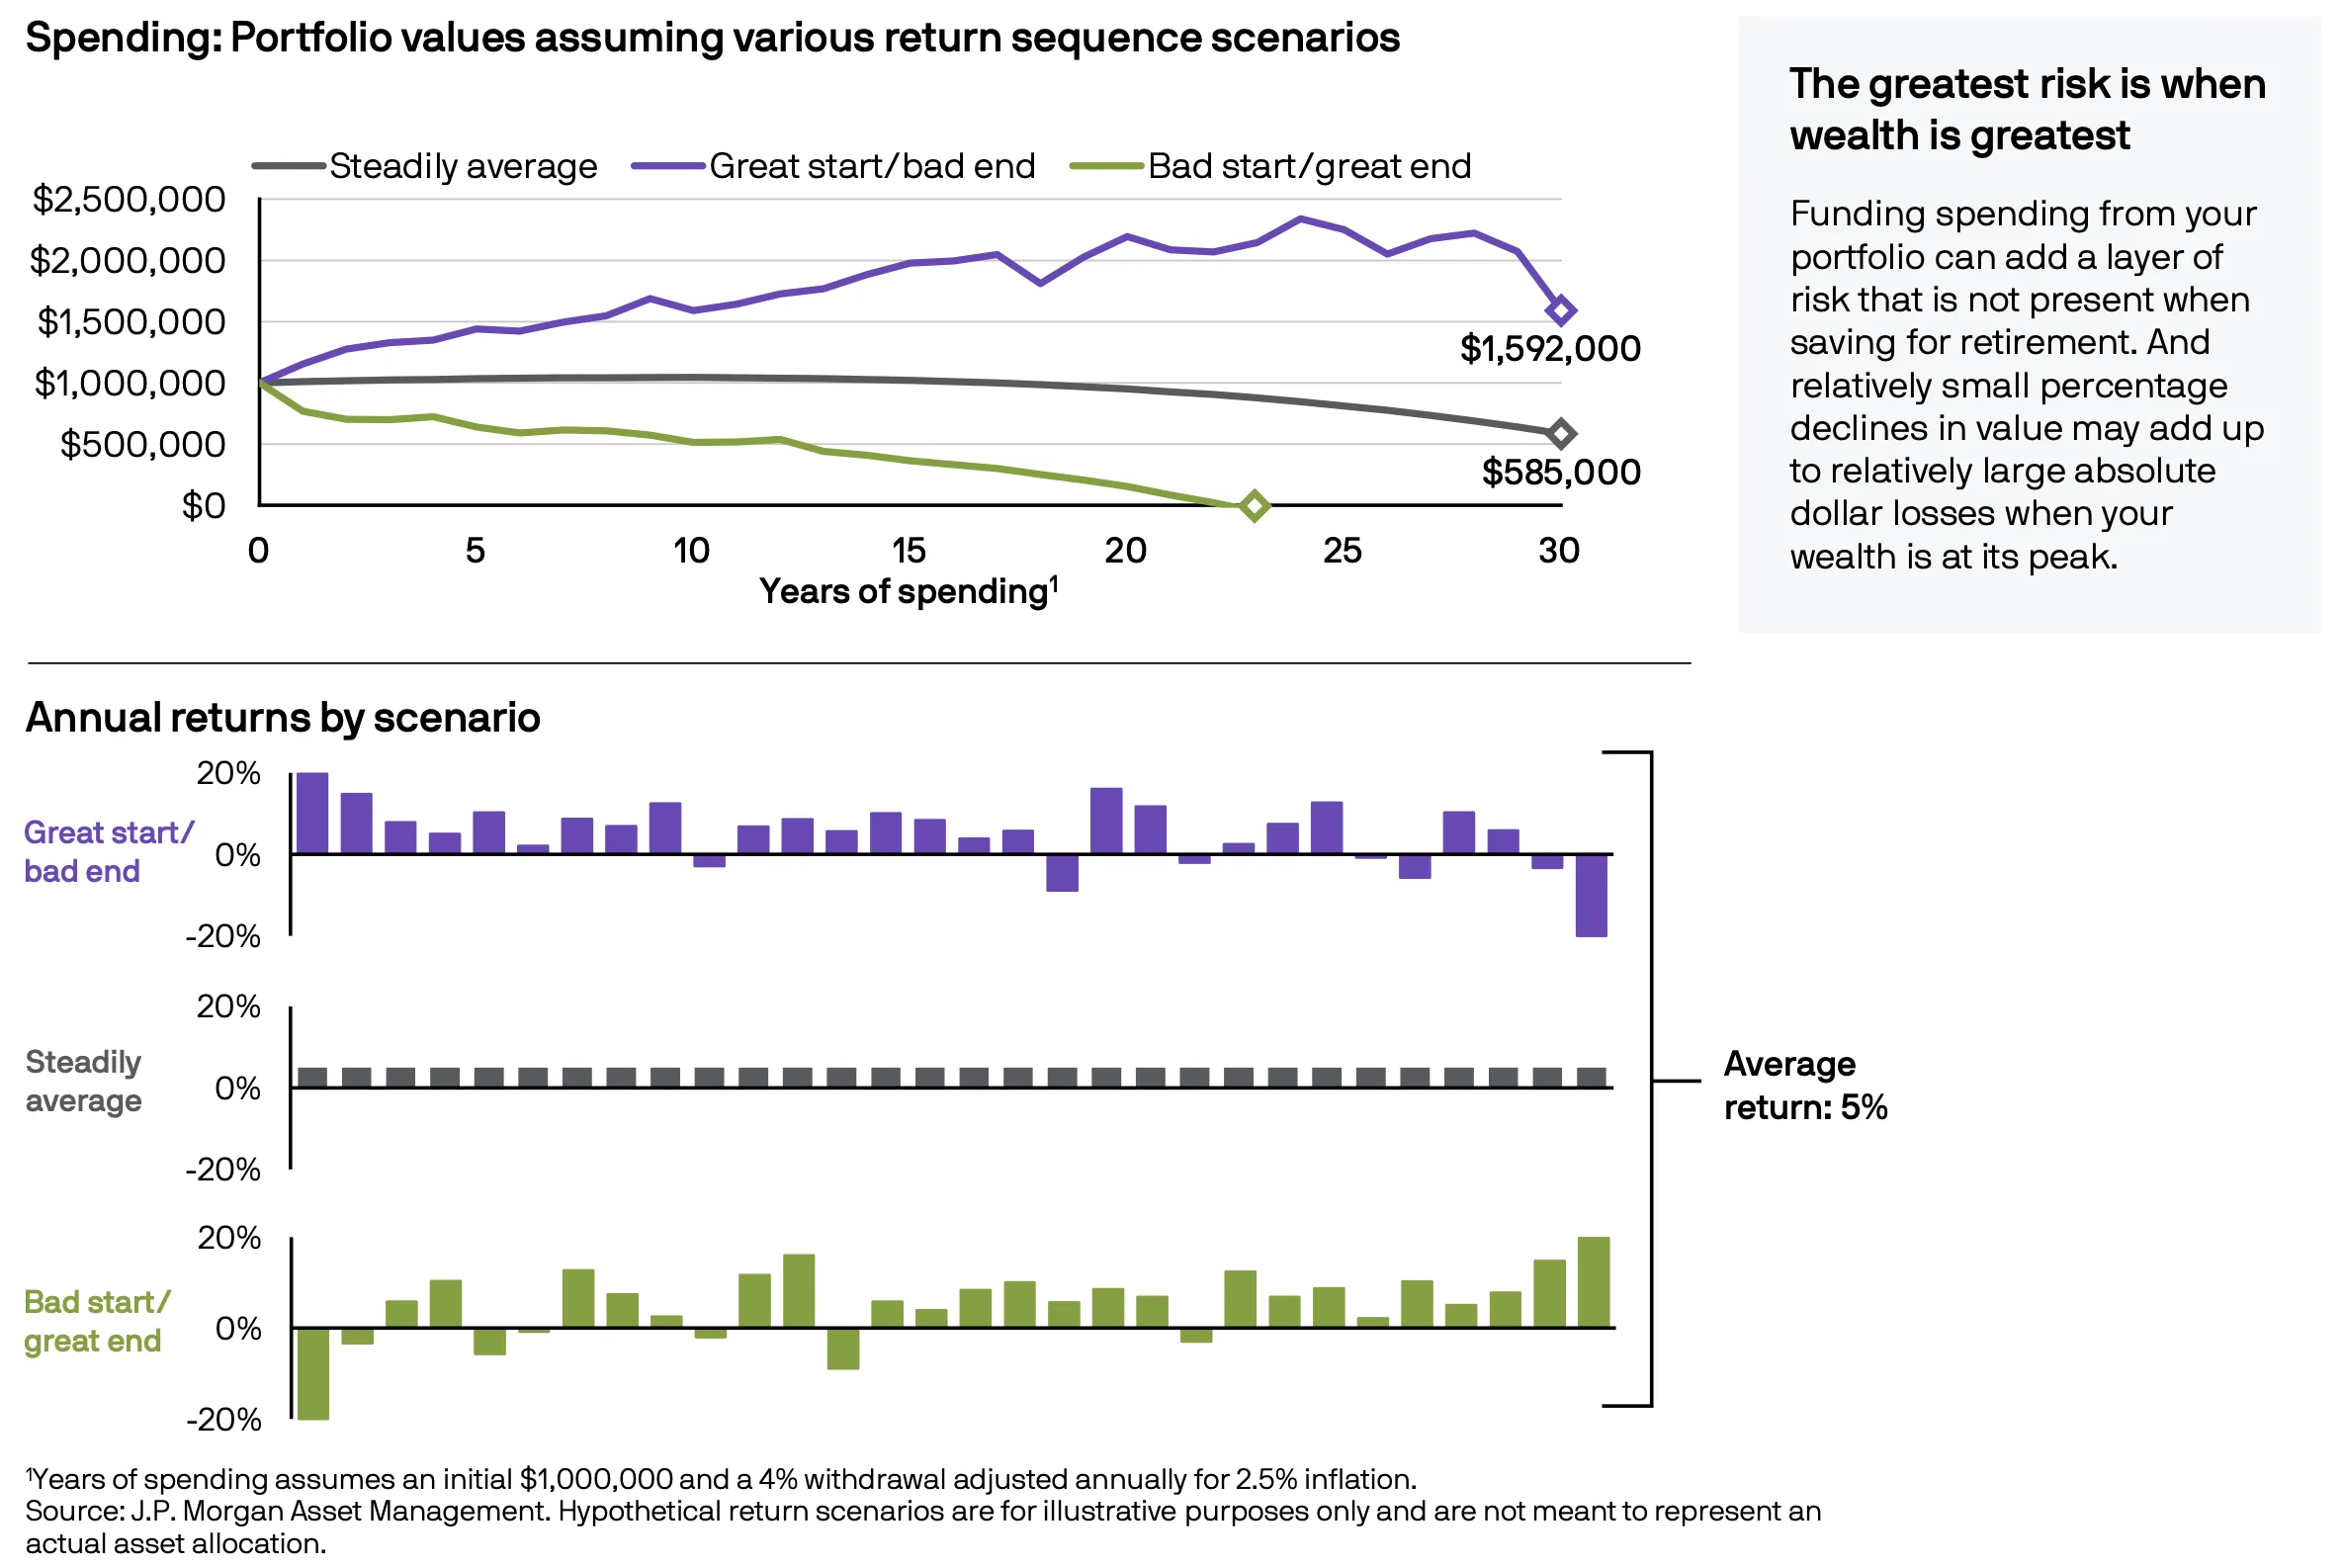
2026 J.P.Morgan Guide to Retirement
March 2026
When retirement begins, the timing of returns can sometimes matter more than the overall returns. As the chart shows, early losses paired with ongoing withdrawals can permanently impact a portfolio—even if long‑term average returns look fine on paper—because you're pulling dollars out when balances are lowest. This risk is called "sequence of returns risk" and is why a portfolio with an appropriate risk profile at retirement is an important part of your retirement strategy.
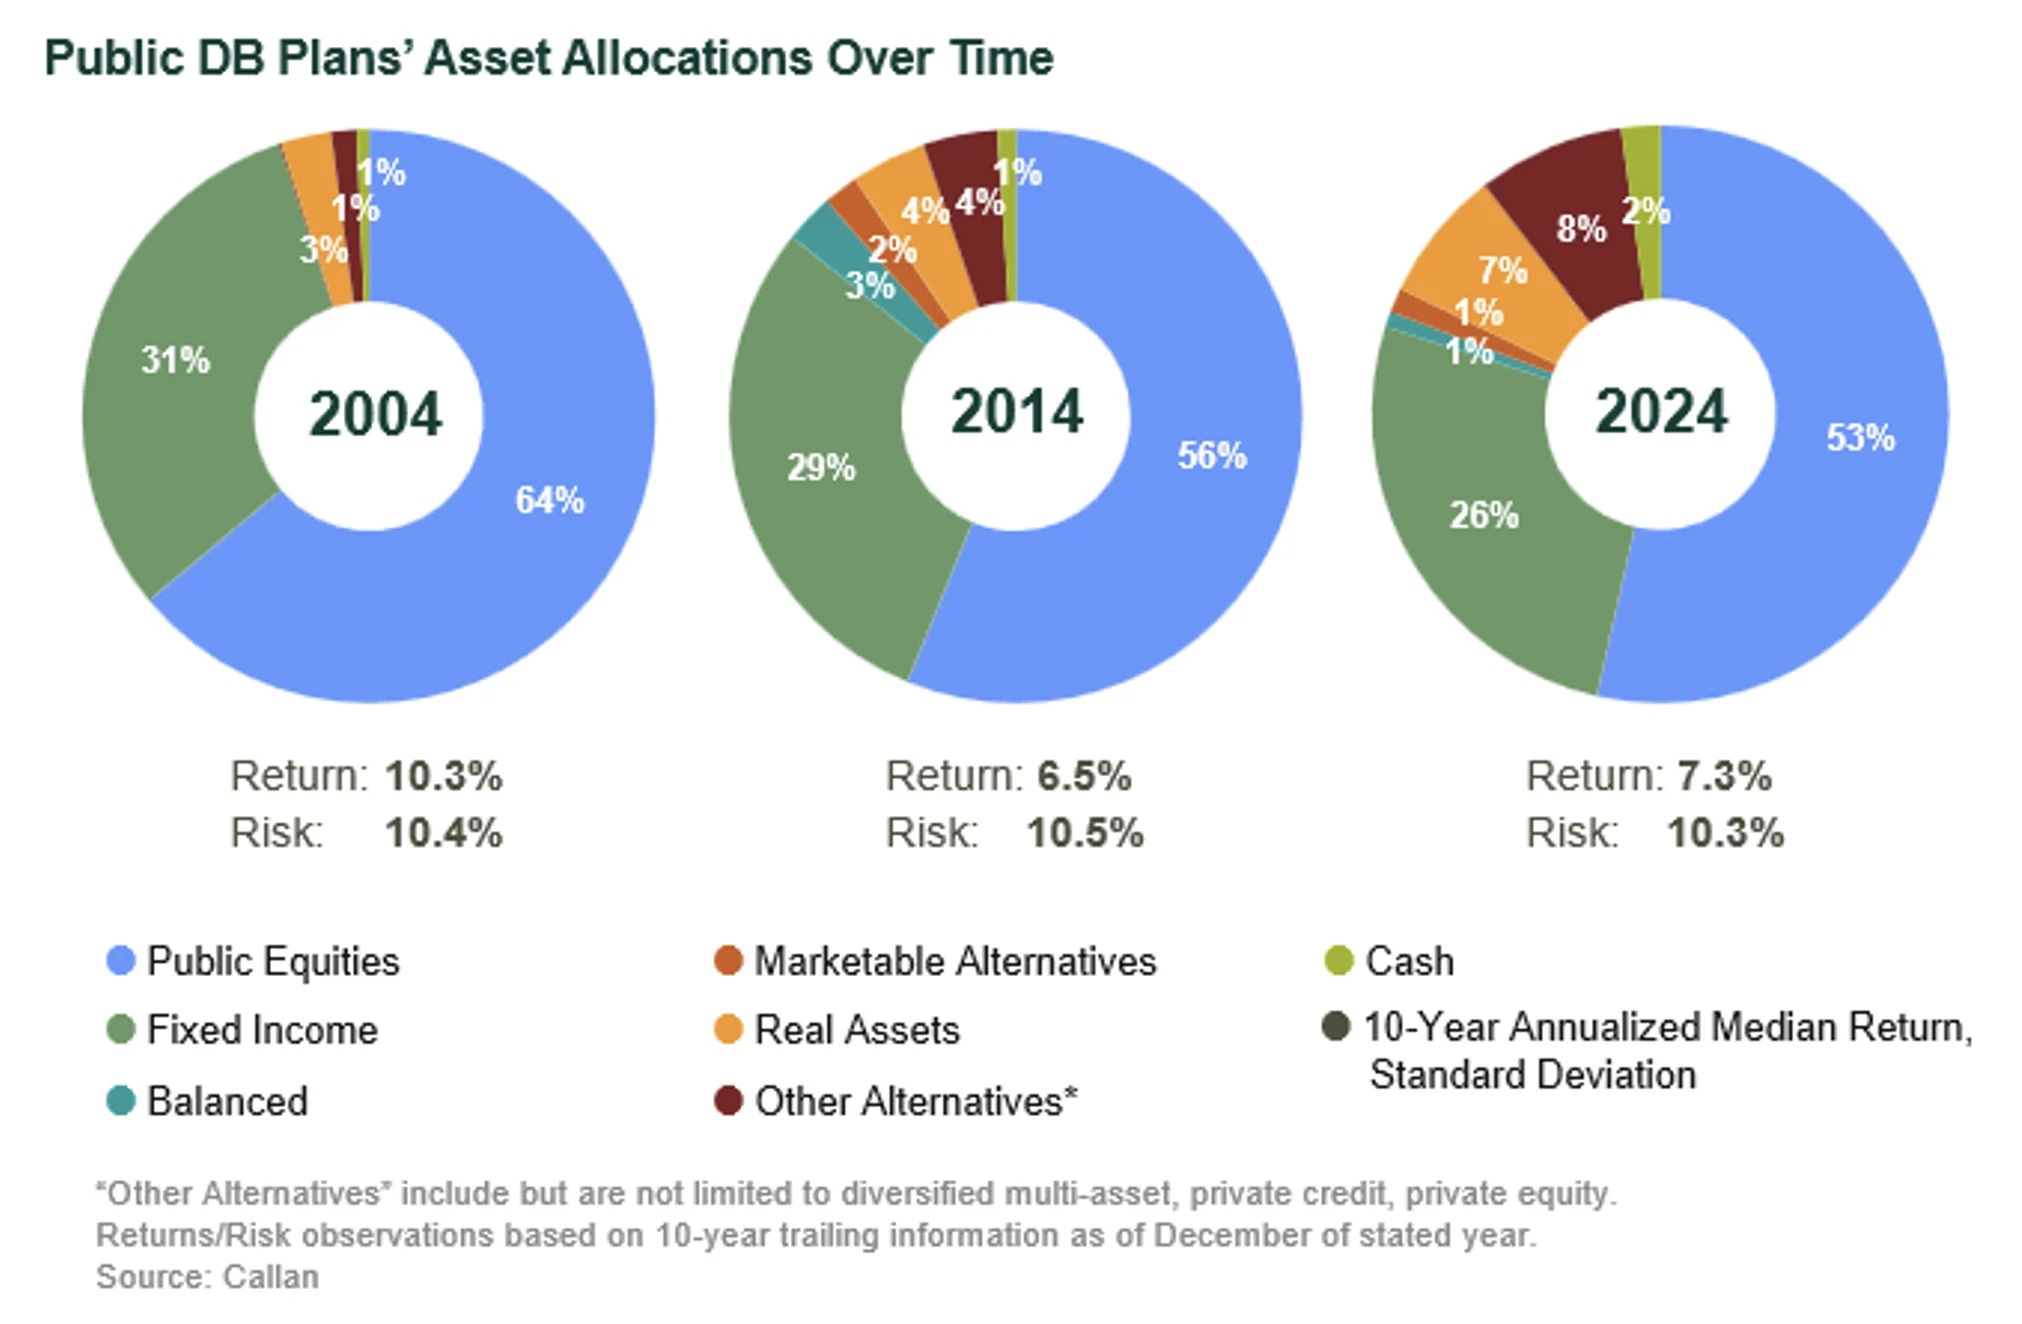
Callan’s Public DB Plan Returns in 1H25 Update and Analysis
February 2026
Over the last two decades, asset allocations utilized by public defined benefit plans have reduced their allocation to public equities by more than 10%. While this could indicate a de-risking on the surface, those assets have been largely reallocated to private rather than public investments in pursuit of a liquidity premium. Fixed income allocations have also dropped by 5%, which has been deployed not only in private credit but also real assets as funds pursued yield in a low rate environment. In more recent years, discount rates have started to decrease while the rate environment has simultaneously started to normalize; while the impact of this may not be visible for years given liquidity restraints in private assets, it will be interesting to see whether asset allocations shift back towards the allocations of old or if the appetite for private assets is here to stay.
Source: https://www.callan.com/blog/public-db-plan-returns-1h25/

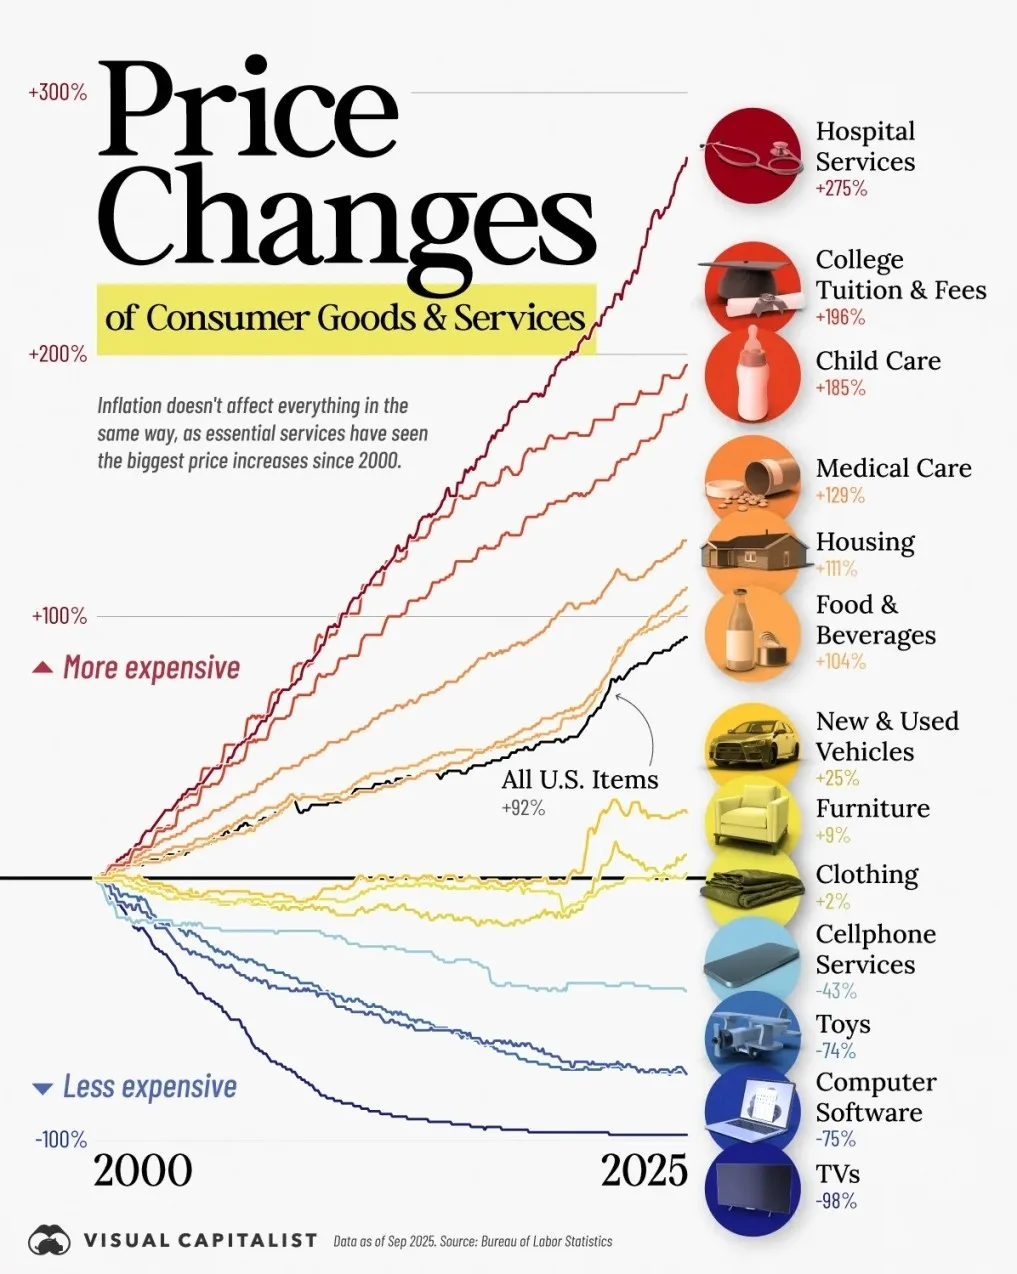
Where Inflation Has Hit the Hardest
January 2026
Inflation as measured by CPI may have moderated over the last several months, but that doesn't mean price changes have affected all goods and services equally. Over the last 25 years, food, housing, and medical care costs have risen at a rate greater than overall inflation. On the flip side, technological advancements and efficiencies have driven down the cost of goods like televisions, software, and cell phone services.
Source: https://www.visualcapitalist.com/chart-inflation-hit-the-hardest-by-category-2000-2025/